1991issue C011-2
Weekly close-to-close volatility as a horizon filter
A weekly historical-volatility reading is a market-regime label used to score later directional tests. Editorial view: treat that label as an evaluation design, not a market call, until absolute daily aggregation, exponential smoothing, a full-standard-deviation band, and several look-ahead windows are compared side by side.
- Historical volatility in this workflow is a weekly series built from absolute close-to-close percent changes and then judged as unusually high or low against its own mean and dispersion.
- A market-regime label only says a reading sits above or below a chosen standard-deviation band, so a later directional test can be read in a high-volatility or low-volatility context.
- Exponential smoothing is a 33-percent recursive average of that weekly series, treated as roughly comparable to a five-week window and scored against the unsmoothed index.
- Extremes were marked with one-standard-deviation and two-thirds bands and scored over the next week, five weeks, 13 weeks, 26 weeks, and the following year.
A weekly label is an evaluation design
This archive article walks through a weekly historical-volatility workflow as an evaluation design. The first product is a market-regime label, not a forecast. A later directional test is scored only after that label is in place.
Editorial view: a weekly volatility reading should not be treated as a market call until absolute daily aggregation, exponential smoothing, a full-standard-deviation band, and several look-ahead windows are compared side by side.
Start from the absolute daily change
A weekly historical-volatility index can be formed by taking each session's absolute percent change in a major industrial average, scaling that change by 1,000, and averaging the scaled values over the week.
That building block is the absolute-daily-change: the unsigned percent move from one session close to the next, scaled by 1,000 so the weekly average is a usable number. Historical volatility, in this usage, is the weekly series of those values, later judged as unusually high or low against its own mean and dispersion.
Hold the unsmoothed week next to a 33-percent smooth
That weekly series can be converted to a 33-percent exponential smooth, presented as roughly comparable to a five-week average. Exponential smoothing here is a 33-percent recursive average of the weekly series, scored against the unsmoothed index.
Both the unsmoothed weekly index and the exponential smooth were scored on every week of a 10-year sample. Editorial view: scoring both constructions keeps an explicit quantitative baseline in view when the regime labels are marked.
Use a standard-deviation band as the regime cut
Extreme readings were marked with two alternative bands: one standard deviation from the mean and two-thirds of one standard deviation from the mean. A standard-deviation-band is that cutoff, used to mark unusual high and low points.
A market-regime is the label that a reading sits above or below the chosen band. The band does not replace the later directional test. It only supplies the high-volatility or low-volatility context for that test.
Score the same reading on five evaluation horizons
Those extremes were tested as directional calls over the next week, the next five weeks, 13 weeks, 26 weeks, and the following year. Each window is an evaluation-horizon: the forward span over which a regime reading is scored as a directional test.
Within that comparison, the exponentially smoothed series and the full-standard-deviation band were treated as the stronger of the two construction pairs that were tested.
Inspect the close-to-close record for a lasting rise
The same close-to-close series was inspected for a lasting rise in day-to-day volatility after program trading became more common. The plotted record was presented as not showing such a rise, while an intradaily effect was left open.
Editorial view: that inspection describes the weekly close-to-close record in the archive sample. It is not a statement about current markets, and it does not settle what happens inside a session.
DJIA weekly close-to-close volatility, 1981–1990
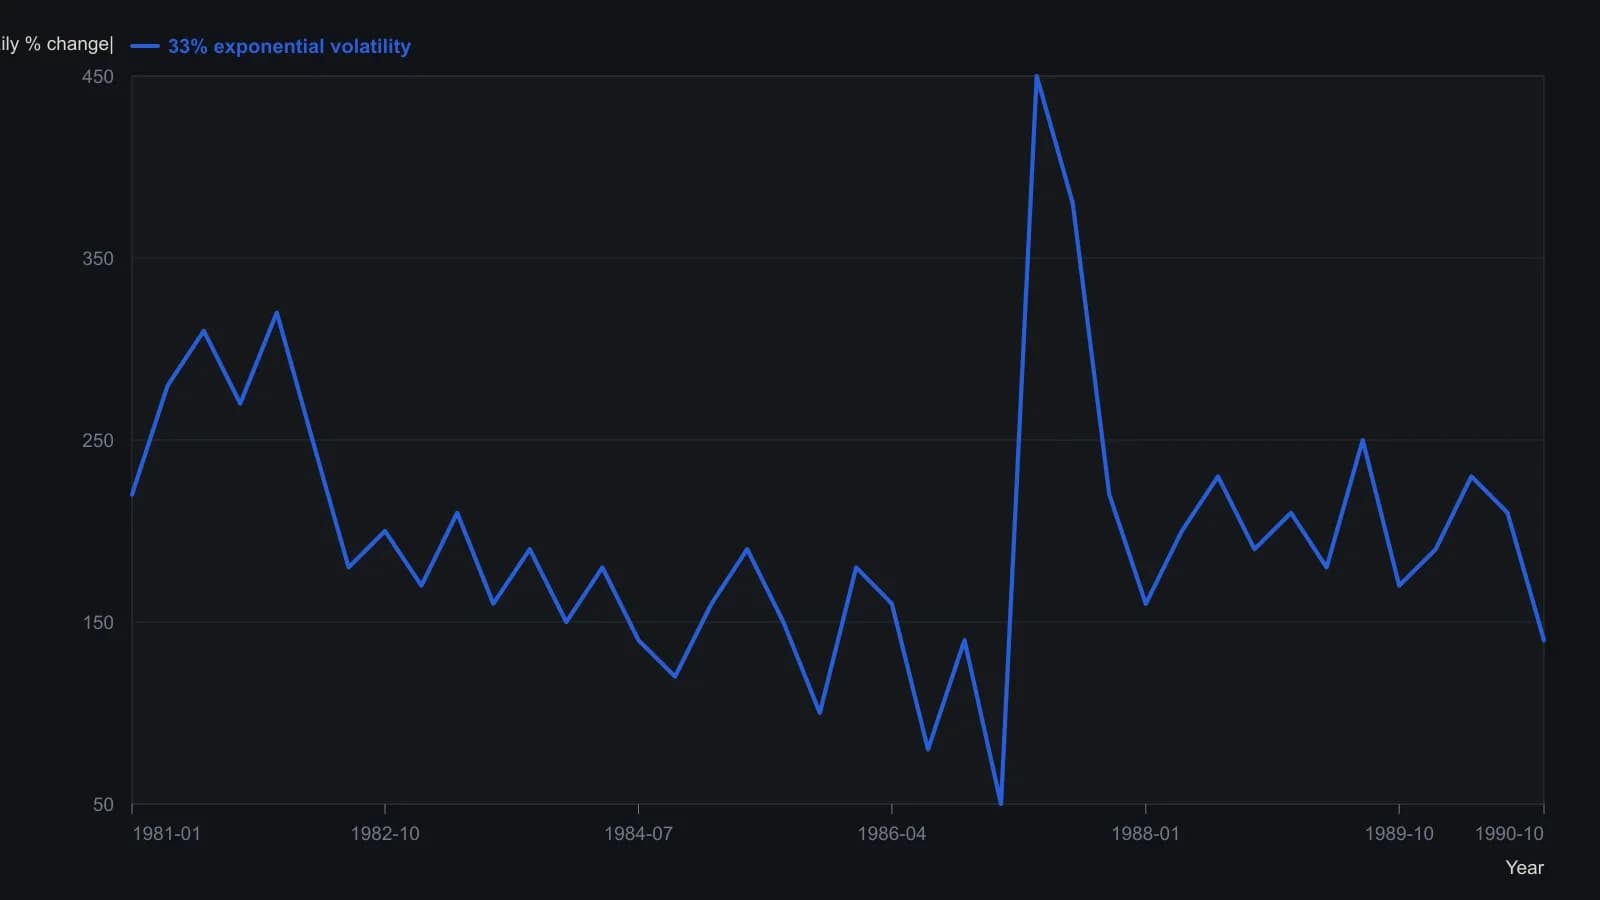
Merrill multiplies absolute daily DJIA close-to-close percent change by 1,000, averages each week, then applies a 33 percent exponential (about a five-week average). Dashed lines are mean and plus or minus one standard deviation. Digitized from the printed plot; weekly ticks are denser than the recovered sample.
All readings on this track · 31 readings
- 1985Putting listed option premiums in volatility-regime context
- 1988When volatility, not direction, selects the option spread
- 1988Path-aware volatility for option-replication cost
- 1989Option premium inside a volatility regime
- 1990Constructing consistent historical and implied volatility
- 1991Weekly close-to-close volatility as a horizon filter
- 1995A modified volatility construction for weeks-to-months regimes
- 1996Option smiles as a critique of constant volatility
- 1996Pairing short and long historical volatility for regime context
- 1998Normalized multi-horizon historical volatility construction
- 2001Park one options idea inside an implied and historical volatility regime
- 2002Constructing vertical spreads inside seasonal volatility regimes
- 2002Volatility regime context for option straddles
- 2003Option spread construction with volatility regime checks
- 2003Trend and volatility filters for option spread choice
- 2005Constructing vertical spreads inside volatility regimes
- 2006Implied volatility doubling as a commodity regime signal
- 2007A butterfly reversal call when implied volatility sits near historical volatility
- 2012Evaluate a broken-wing butterfly inside a volatility and premium regime
- 2012Regime-aware equity construction via carry and risk premium
- 2012True range overlays versus isolated bar context
- 2012Constructing regime context for option premium trades
- 2013Construct a ranked volatility switch before the trend filter fires
- 2013Combining Relative Strength Index, historical volatility, and Bollinger %b screens
- 2014A headline equity high is incomplete until the nominal-real spread is read
- 2015Daily implied volatility skew as a portfolio benchmark
- 2015Rebuild a volatility-skew template from size and slope
- 2015Evaluating concentrated winners with volatility and option premiums
- 2017Option book construction from implied volatility, historical volatility and premium
- 2018One-year volatility as the backdrop for short-horizon option trades
- 2019A low-volatility ETF sleeve inside a 2011 to 2019 market-regime case study