1996issue C051-6
Option smiles as a critique of constant volatility
Standard option models treat volatility as constant and treat log percentage price changes as normally distributed around a mean. This archive article sets realized weekly tails and the cross-strike implied-volatility smile against that premise. Editorial reading: treat the smile as a market map of how premiums price distant outcomes, then check that map against realized occurrence rates.
- Standard option models used to compute premiums treat volatility as constant and treat log percentage price changes as normally distributed around a mean.
- Normalized weekly S&P 500 log changes placed more outcomes inside one standard deviation than a normal curve implies, fewer outcomes between one and 2.50 standard deviations, and more declines beyond minus 2.50 standard deviations, including one drop larger than nine standard deviations.
- Implied volatility recovered from observed premiums, scaled by each stock's five-year historical volatility, was markedly higher for deep in-the-money and far out-of-the-money strikes than for near-the-money strikes.
- The smile can be read as the market pricing non-normal outcome frequencies or as demand for low-probability payoffs; comparing realized occurrence rates with the premium on far-from-the-money strikes is the offered check.
Read the smile as a market map
Editorial. Treat the cross-strike implied-volatility surface as a market map of how premiums price distant outcomes, then check that map against realized weekly tails instead of trusting a constant-volatility, log-normal engine.
What the premium engine assumes
Standard option models used to compute premiums treat volatility as constant and treat log percentage price changes as normally distributed around a mean.
The constant-volatility assumption is the modeling premise that a single volatility and a normal distribution of log percentage changes fully describe future outcomes.
Weekly tails against the normal curve
Across 493 weeks of S&P 500 log changes from April 1986 through December 1995, the mean weekly change was 0.19% and the weekly standard deviation was 2.0%.
After those weekly changes were normalized to zero mean and unit variance, 75.4% of outcomes fell inside one standard deviation, versus 68.2% under a normal curve.
Moves between one and 2.50 standard deviations were less frequent than a normal distribution implies (22.25% versus 29.5%), while declines beyond -2.50 standard deviations occurred six times, more than twice the normal-curve count, including one 18.3% drop larger than nine standard deviations.
What the market is charging
Implied volatility is the unknown annualized standard deviation backed out of an observed premium once strike, underlying price, time to expiration, the risk-free rate, and yield are treated as known. Option premium analysis is that recovery: the volatility the market is charging after strike, spot, time, rate, and yield are treated as known.
Historical volatility is a realized standard deviation of past log price changes used as a benchmark for how far a strike sits from the underlying. Moneyness in standard deviations is the distance of a strike from the underlying, scaled by the asset's own long-horizon historical volatility.
The smile across liquid equity options
On 14 February 1996, implied volatilities for about 2,500 liquid equity options, scaled by each stock's five-year historical volatility, were markedly higher for deep in-the-money and far out-of-the-money strikes than for near-the-money strikes.
The volatility smile is that pattern: implied volatility rises as strikes move deep in-the-money or far out-of-the-money relative to near-the-money strikes.
One name with an irregular smile
Normalized Intel price changes as of 28 February 1996 showed extra mass between the mean and one standard deviation plus a single -28.58% decline at minus five standard deviations, and Intel options displayed an irregular implied-volatility smile.
S&P 500 weekly log changes versus a normal curve
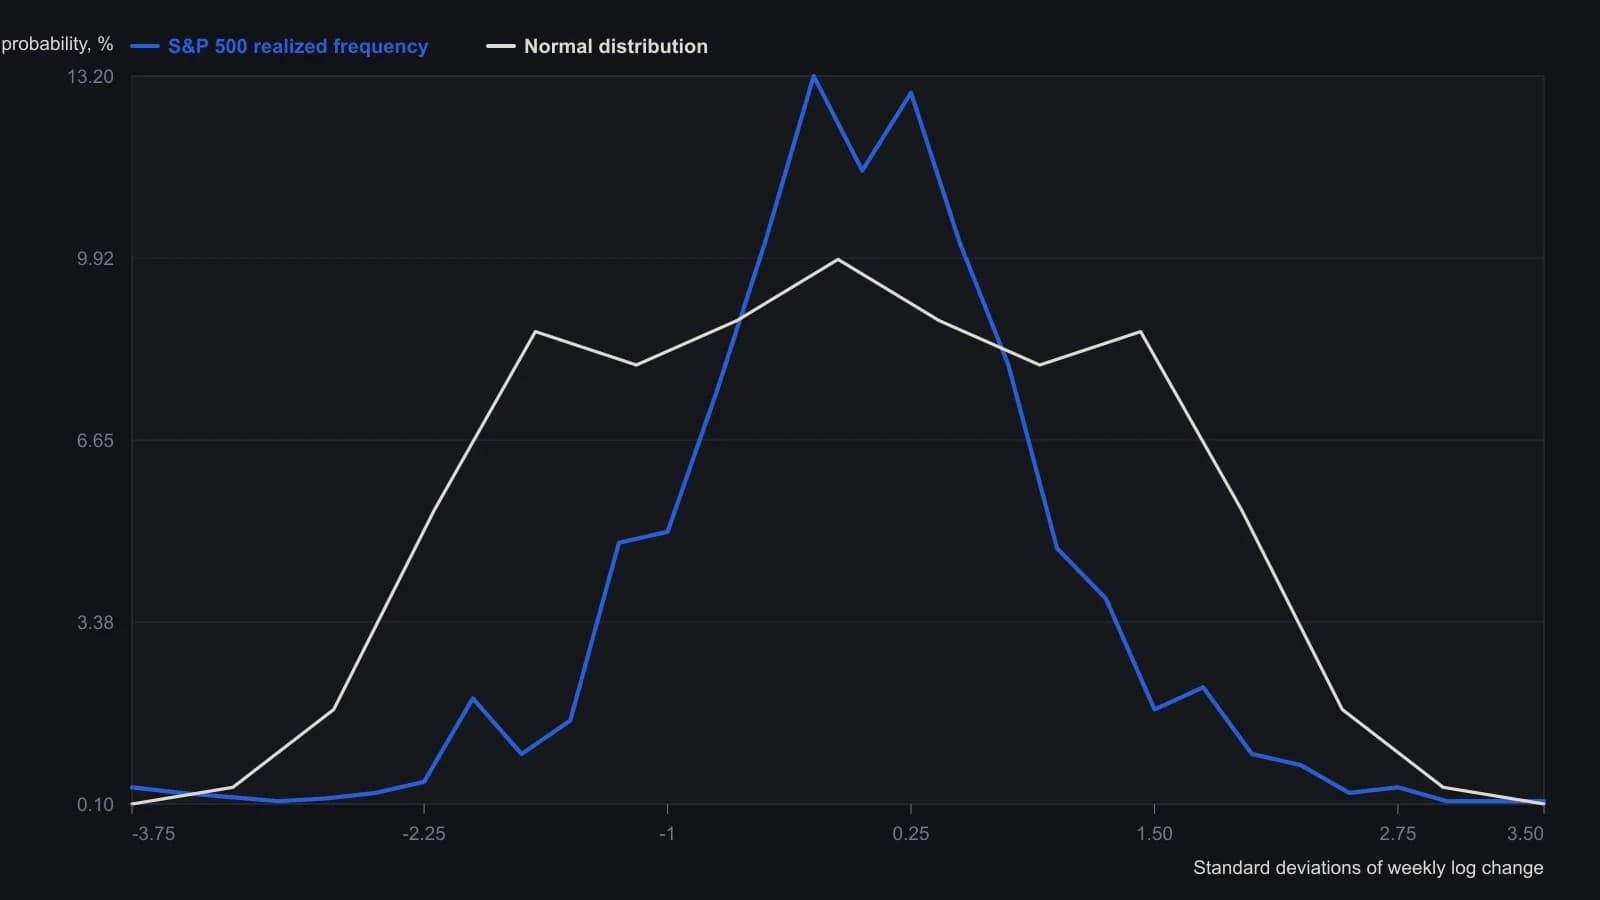
Source used 493 weekly natural-log changes in the S&P 500, mean 0.19% and weekly standard deviation 2.0%, then subtracted the mean and divided by 2.0% so the histogram is in unit-normal space. One week is the October 1987 crash (−18.3%, more than nine standard deviations), which sits off this ±4 scale.
Two readings and a check
The smile can be read either as the market pricing non-normal outcome frequencies or as demand for low-probability payoffs.
Comparing realized occurrence rates with the premium on far-from-the-money strikes is offered as a check on that reading.
All readings on this track · 31 readings
- 1985Putting listed option premiums in volatility-regime context
- 1988When volatility, not direction, selects the option spread
- 1988Path-aware volatility for option-replication cost
- 1989Option premium inside a volatility regime
- 1990Constructing consistent historical and implied volatility
- 1991Weekly close-to-close volatility as a horizon filter
- 1995A modified volatility construction for weeks-to-months regimes
- 1996Option smiles as a critique of constant volatility
- 1996Pairing short and long historical volatility for regime context
- 1998Normalized multi-horizon historical volatility construction
- 2001Park one options idea inside an implied and historical volatility regime
- 2002Constructing vertical spreads inside seasonal volatility regimes
- 2002Volatility regime context for option straddles
- 2003Option spread construction with volatility regime checks
- 2003Trend and volatility filters for option spread choice
- 2005Constructing vertical spreads inside volatility regimes
- 2006Implied volatility doubling as a commodity regime signal
- 2007A butterfly reversal call when implied volatility sits near historical volatility
- 2012Evaluate a broken-wing butterfly inside a volatility and premium regime
- 2012Regime-aware equity construction via carry and risk premium
- 2012True range overlays versus isolated bar context
- 2012Constructing regime context for option premium trades
- 2013Construct a ranked volatility switch before the trend filter fires
- 2013Combining Relative Strength Index, historical volatility, and Bollinger %b screens
- 2014A headline equity high is incomplete until the nominal-real spread is read
- 2015Daily implied volatility skew as a portfolio benchmark
- 2015Rebuild a volatility-skew template from size and slope
- 2015Evaluating concentrated winners with volatility and option premiums
- 2017Option book construction from implied volatility, historical volatility and premium
- 2018One-year volatility as the backdrop for short-horizon option trades
- 2019A low-volatility ETF sleeve inside a 2011 to 2019 market-regime case study