1995issue C041-14
A modified volatility construction for weeks-to-months regimes
A listed implied-volatility composite can be rebuilt as a two-factor series that pairs option-premium richness with how far the cash index sits from a medium-horizon average. Long-horizon bands then locate that hybrid as a weeks-to-months market regime rather than as a standalone sentiment spike.
- Historical volatility is the standard deviation of an asset's rates of return. Implied volatility is the input that makes an option pricing model match the traded price, and the two estimates can differ.
- Option-premium analysis maps a listed volatility index so that very high readings mean the component options are expensive versus their own history and very low readings mean they are cheap.
- A modified-volatility-construction combines cash-index distance from a 21-day moving average with the volatility-index close, using 252 as the approximate number of trading days in a year.
- Standard-deviation-bands around a 252-day exponential moving average locate the hybrid as a market regime, including archive episodes when the raw index stayed low while the modified series moved first.
Implied and historical volatility
Historical volatility is the standard deviation of an asset's rates of return, equal to the square root of return variance. Implied volatility is the volatility input that makes a chosen option pricing model match the option's observed market price.
Those two estimates can differ at the same moment. A listed composite built from implied volatility therefore does not automatically restate contemporaneous statistical volatility.
The listed volatility index
The volatility index is a composite of implied volatilities from eight near-the-money nearby and second-nearby S&P 100 calls and puts, adjusted for remaining time and moneyness.
Option-premium analysis judges whether those listed index options are expensive or cheap relative to their own history by mapping the level of that composite. When the index is very high, the options used to compute it are expensive relative to their historical prices. When the index is very low, those options are cheap.
How the raw index behaved
In the historical window described, the index reached a high of 150 in 1987 and a low of about 8 in 1993-94. Extreme lows clustered at 8% to 9%, while readings greater than 20% were described as fairly uncommon in the then-recent period.
The index generally declined during orderly equity advances and rose during declines. Steeper and more abrupt declines were associated with higher readings.
The modified two-factor series
A modified-volatility-construction is a two-factor series that combines cash-index distance from a selected moving average with the volatility-index close and a 252-day annualization factor. In the archive workflow the cash input is the S&P 100 or S&P 500 close's distance from a 21-day moving average, and 252 is treated as the approximate number of trading days in a year.
If the cash index equals its moving average, the construction prints zero regardless of the volatility-index level. The options factor cannot, on its own, pull the hybrid off that zero print.
Bands that locate a market regime
The modified series is framed with a 252-day exponential moving average and standard-deviation-bands at one, one and a half, and two standard deviations that center about zero. Those dynamic envelopes mark unusual readings of the hybrid.
A market regime, in this workflow, is a weeks-to-months state describing whether implied volatility and option premium are elevated, depressed, or mid-range relative to recent history and the cash index's location.
Two-standard-deviation penetrations of the modified series accompanied extreme raw-index readings. In early 1994 and August-September 1994 the raw index stayed low while the modified series moved first ahead of a potential decline.
Modified VIX implied-risk against 252-day bands, 1994
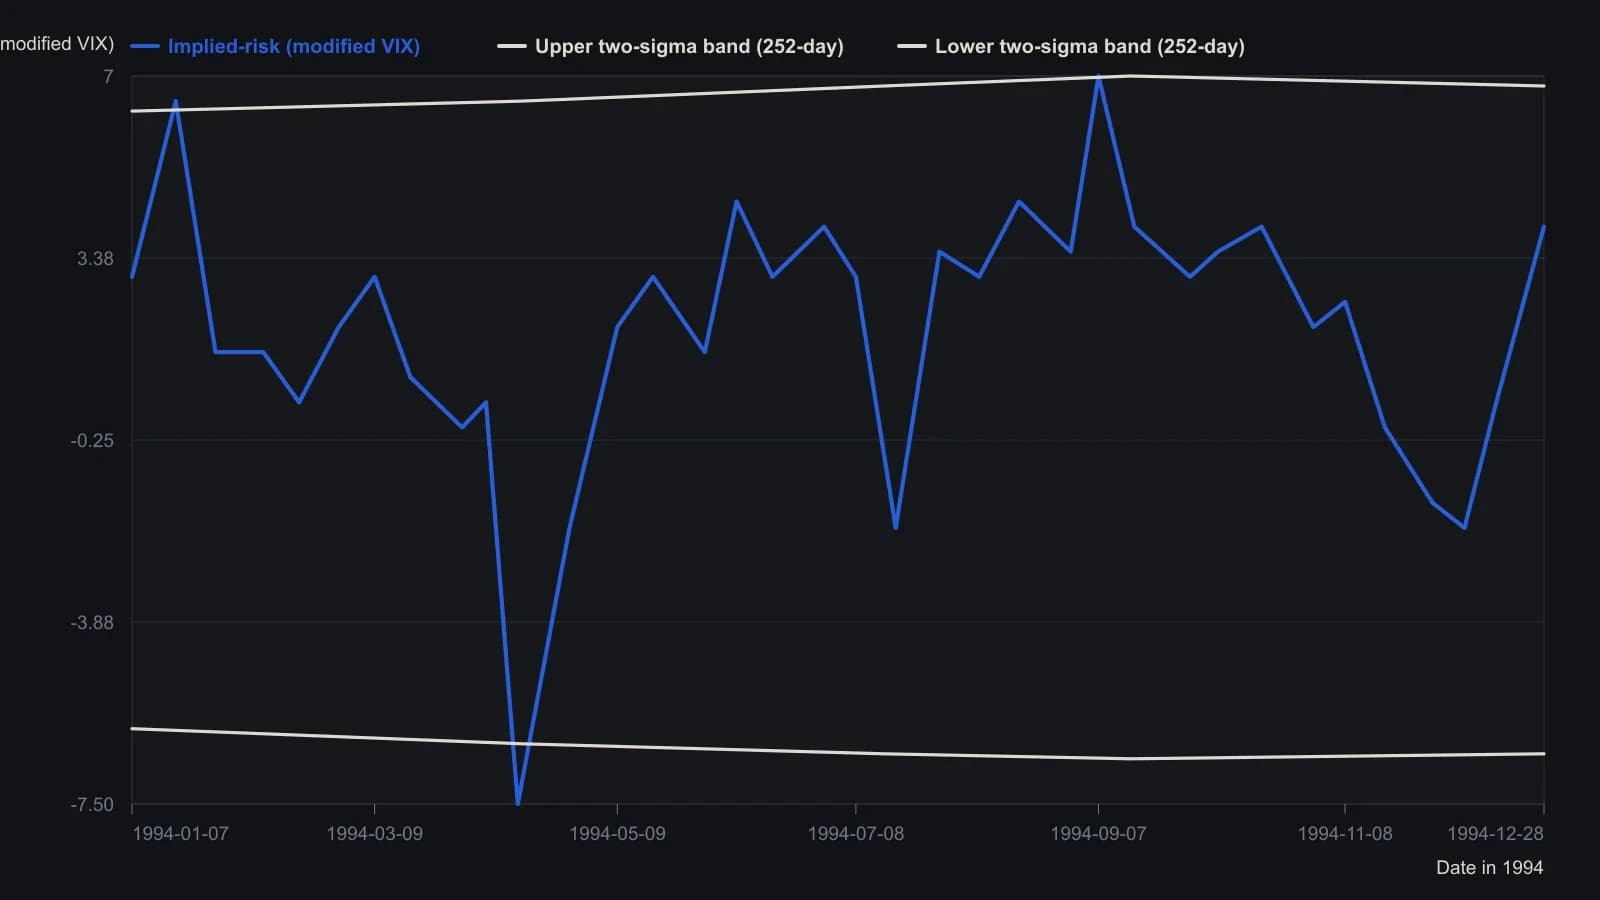
Karczewski multiplies the percent gap between the S&P 500 and a 21-session average by the VIX, scaled by sqrt(252/21). The bands are a 252-session EMA plus one, 1.5 and two standard deviations; he chose 252 sessions to cut down on false breaks. Digitized from a magazine raster, so readings are approximate to about half a point.
All readings on this track · 31 readings
- 1985Putting listed option premiums in volatility-regime context
- 1988When volatility, not direction, selects the option spread
- 1988Path-aware volatility for option-replication cost
- 1989Option premium inside a volatility regime
- 1990Constructing consistent historical and implied volatility
- 1991Weekly close-to-close volatility as a horizon filter
- 1995A modified volatility construction for weeks-to-months regimes
- 1996Option smiles as a critique of constant volatility
- 1996Pairing short and long historical volatility for regime context
- 1998Normalized multi-horizon historical volatility construction
- 2001Park one options idea inside an implied and historical volatility regime
- 2002Constructing vertical spreads inside seasonal volatility regimes
- 2002Volatility regime context for option straddles
- 2003Option spread construction with volatility regime checks
- 2003Trend and volatility filters for option spread choice
- 2005Constructing vertical spreads inside volatility regimes
- 2006Implied volatility doubling as a commodity regime signal
- 2007A butterfly reversal call when implied volatility sits near historical volatility
- 2012Evaluate a broken-wing butterfly inside a volatility and premium regime
- 2012Regime-aware equity construction via carry and risk premium
- 2012True range overlays versus isolated bar context
- 2012Constructing regime context for option premium trades
- 2013Construct a ranked volatility switch before the trend filter fires
- 2013Combining Relative Strength Index, historical volatility, and Bollinger %b screens
- 2014A headline equity high is incomplete until the nominal-real spread is read
- 2015Daily implied volatility skew as a portfolio benchmark
- 2015Rebuild a volatility-skew template from size and slope
- 2015Evaluating concentrated winners with volatility and option premiums
- 2017Option book construction from implied volatility, historical volatility and premium
- 2018One-year volatility as the backdrop for short-horizon option trades
- 2019A low-volatility ETF sleeve inside a 2011 to 2019 market-regime case study