2014issue C1322-24
A headline equity high is incomplete until the nominal-real spread is read
A new index high is only half the print. Pairing monthly closes with monthly CPI-U readings turns the gap between the unadjusted path and the inflation-adjusted close into an intermarket overlay. Editorial reading: that nominal-real spread places one index move in a purchasing-power regime over weeks to months.
- A headline equity high is an incomplete print until monthly CPI-U is plotted as a second series.
- Pairing monthly closes with CPI-U produces an inflation-adjusted close; the gap versus the unadjusted series is the nominal-real spread.
- The same intermarket overlay can be read in more than one regime window, including the 1929 crash and a later all-time-high attempt.
- Editorial reading: later resolution of that spread belongs in a weeks-to-months market-regime view of how much prices moved in purchasing-power terms.
An incomplete print
In mid-September 2012, major equity indexes were making a third attempt at all-time highs since 2000, while everyday prices such as fuel and food were also at new highs. The index print alone does not say whether that advance held its size in purchasing-power terms. Editorial reading: a headline high stays incomplete until CPI-U is plotted as a second series and the gap is read as a nominal-real spread.
How the restatement is built
An equity index can be restated in purchasing-power terms by pairing monthly closes with monthly CPI-U readings. The worked example applies that restatement to S&P 500 monthly closes beginning in 1871.
Period inflation is measured as the change in consecutive monthly CPI readings scaled by their two-month average, then compounded from a starting factor of 1 and applied to the matching close. That produces an inflation-adjusted close next to the unadjusted monthly close, so the dollar path and the purchasing-power path can be compared.
S&P 500 monthly close versus CPI-adjusted restatement, May 2010–August 2012
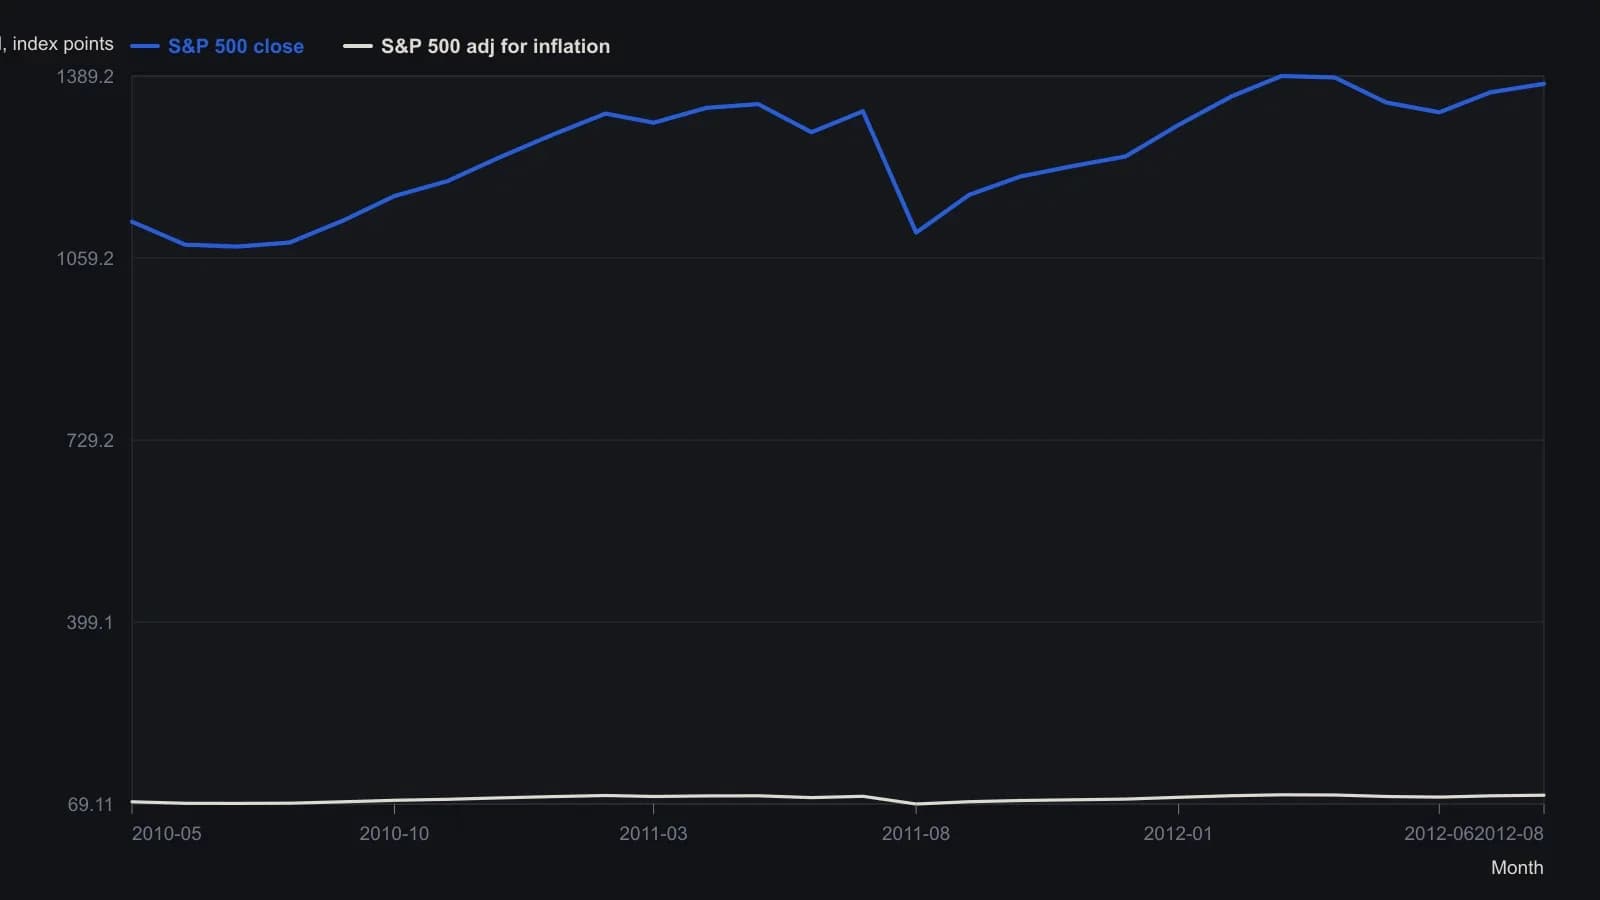
Inflation-adjusted close equals the monthly S&P 500 close divided by the cumulative CPI-U factor that starts at 1 in February 1871. Month-to-month CPI return uses (CPI_t − CPI_{t−1}) / ((CPI_t + CPI_{t−1}) / 2). September–October 2012 rows in the sheet are blank and are omitted.
Two regime windows
Overlaying the unadjusted monthly close and the inflation-adjusted close from 1871 onward changes how the long-term price path is read. In the 1929 crash window, inflation moved in step with equity performance on both advances and declines.
In the later high-attempt window, the gap between the nominal S&P 500 and its inflation-adjusted counterpart widened as prices rose, showing inflation reducing the real size of the advance. Those two episodes are separate regime windows inspected with the same inflation overlay.
The spread as regime context
The same intermarket overlay is used in both a crash episode and a later all-time-high attempt, so the nominal-real spread is cross-regime context rather than a single-date snapshot. The case study treats that gap as a spread whose later resolution belongs in a long-horizon market-regime reading, including how much prices moved in real terms after September 2012.
Editorial reading: the weeks-to-months use of this overlay is to place one index move in a purchasing-power regime, not to treat the headline high as a finished statement.
All readings on this track · 31 readings
- 1985Putting listed option premiums in volatility-regime context
- 1988When volatility, not direction, selects the option spread
- 1988Path-aware volatility for option-replication cost
- 1989Option premium inside a volatility regime
- 1990Constructing consistent historical and implied volatility
- 1991Weekly close-to-close volatility as a horizon filter
- 1995A modified volatility construction for weeks-to-months regimes
- 1996Option smiles as a critique of constant volatility
- 1996Pairing short and long historical volatility for regime context
- 1998Normalized multi-horizon historical volatility construction
- 2001Park one options idea inside an implied and historical volatility regime
- 2002Constructing vertical spreads inside seasonal volatility regimes
- 2002Volatility regime context for option straddles
- 2003Option spread construction with volatility regime checks
- 2003Trend and volatility filters for option spread choice
- 2005Constructing vertical spreads inside volatility regimes
- 2006Implied volatility doubling as a commodity regime signal
- 2007A butterfly reversal call when implied volatility sits near historical volatility
- 2012Evaluate a broken-wing butterfly inside a volatility and premium regime
- 2012Regime-aware equity construction via carry and risk premium
- 2012True range overlays versus isolated bar context
- 2012Constructing regime context for option premium trades
- 2013Construct a ranked volatility switch before the trend filter fires
- 2013Combining Relative Strength Index, historical volatility, and Bollinger %b screens
- 2014A headline equity high is incomplete until the nominal-real spread is read
- 2015Daily implied volatility skew as a portfolio benchmark
- 2015Rebuild a volatility-skew template from size and slope
- 2015Evaluating concentrated winners with volatility and option premiums
- 2017Option book construction from implied volatility, historical volatility and premium
- 2018One-year volatility as the backdrop for short-horizon option trades
- 2019A low-volatility ETF sleeve inside a 2011 to 2019 market-regime case study