2003issue C021-3
Trend and volatility filters for option spread choice
The historical workflow selects a large options chain, assigns a 30-day trend-label, and ranks at-the-money implied volatility against statistical volatility. A call-side or put-side spread-lookup then names one continuation-aligned candidate. Editorial view: treat those two questions as a checklist so the intersecting cell, not a favorite structure, drives the trade.
- The procedure first selects an underlying with a large options chain so more spread constructions and better liquidity are available.
- A 30-day trend-label, including a volatile override when a flat move arrives with statistical volatility above 40 percent, is then paired with an iv-versus-sv-rank of at-the-money implied volatility versus statistical volatility.
- A call-side or put-side spread-lookup maps those two labels to one continuation-aligned candidate, such as long-call or put-credit styles in uptrends and long-put or call-debit styles in downtrends.
- Editorial view: the intersecting cell, not a favorite structure, names the trade, and the percentage cutoffs that define the labels are adjustable to the instrument, conditions, and holding horizon.
Begin with a large options chain
The procedure first selects an underlying with a large options chain so more spread constructions and better liquidity are available. Only after that step does it classify the last 30 days of price change and compare at-the-money implied volatility with statistical volatility.
Label the last month of direction
A 30-day price change is assigned one of five trend-label buckets using illustrative cutoffs of +8 percent, +3 percent, -3 percent, and -8 percent. The discrete labels run from way-up through way-down.
When the 30-day change sits between +3 percent and -3 percent and statistical volatility exceeds 40 percent, the trend is labeled volatile rather than merely neutral. That volatile override marks a flat move that arrives with high realized speed.
Rank implied volatility against realized speed
Statistical volatility measures how fast historical prices have been moving. It is defined as the square root of 253 multiplied by the standard deviation of historical prices and is therefore annualized with a 253-session factor.
Implied volatility is the market's implied forecast of future underlying variability. It is treated as the unknown pricing-model input recovered iteratively so model value matches the observed option price given the underlying, strike, time, rates, and dividends.
At-the-money call and put implied volatility is ranked against statistical volatility. The rank is high when implied exceeds statistical by 25 percent and low when implied is 10 percent below statistical. That comparison is the iv-versus-sv-rank: a three-way expensive, neutral, or cheap label.
Read the intersecting cell
Separate call-side and put-side matrices provide the spread-lookup. Each map converts a trend-label plus an implied-volatility rank into one candidate multi-leg structure under the assumption that the observed trend continues.
Continuation-aligned cells favor long-call, put-credit, and covered-call style structures in uptrends and long-put, call-debit, and short-call style structures in downtrends. Neutral cells favor short straddles or strangles and ratio constructions.
A way-down, low-implied illustration
In a 2001 Microsoft illustration, a -13 percent 30-day move and put implied volatility of 23 percent versus 33 percent statistical volatility produced a way-down, low-implied classification that selected a long put.
Keep the percentage cutoffs adjustable
Trend and implied-volatility percentage cutoffs are presented as adjustable to the instrument, prevailing conditions, and holding horizon rather than as fixed constants.
Statistical historical volatility on Microsoft, three windows
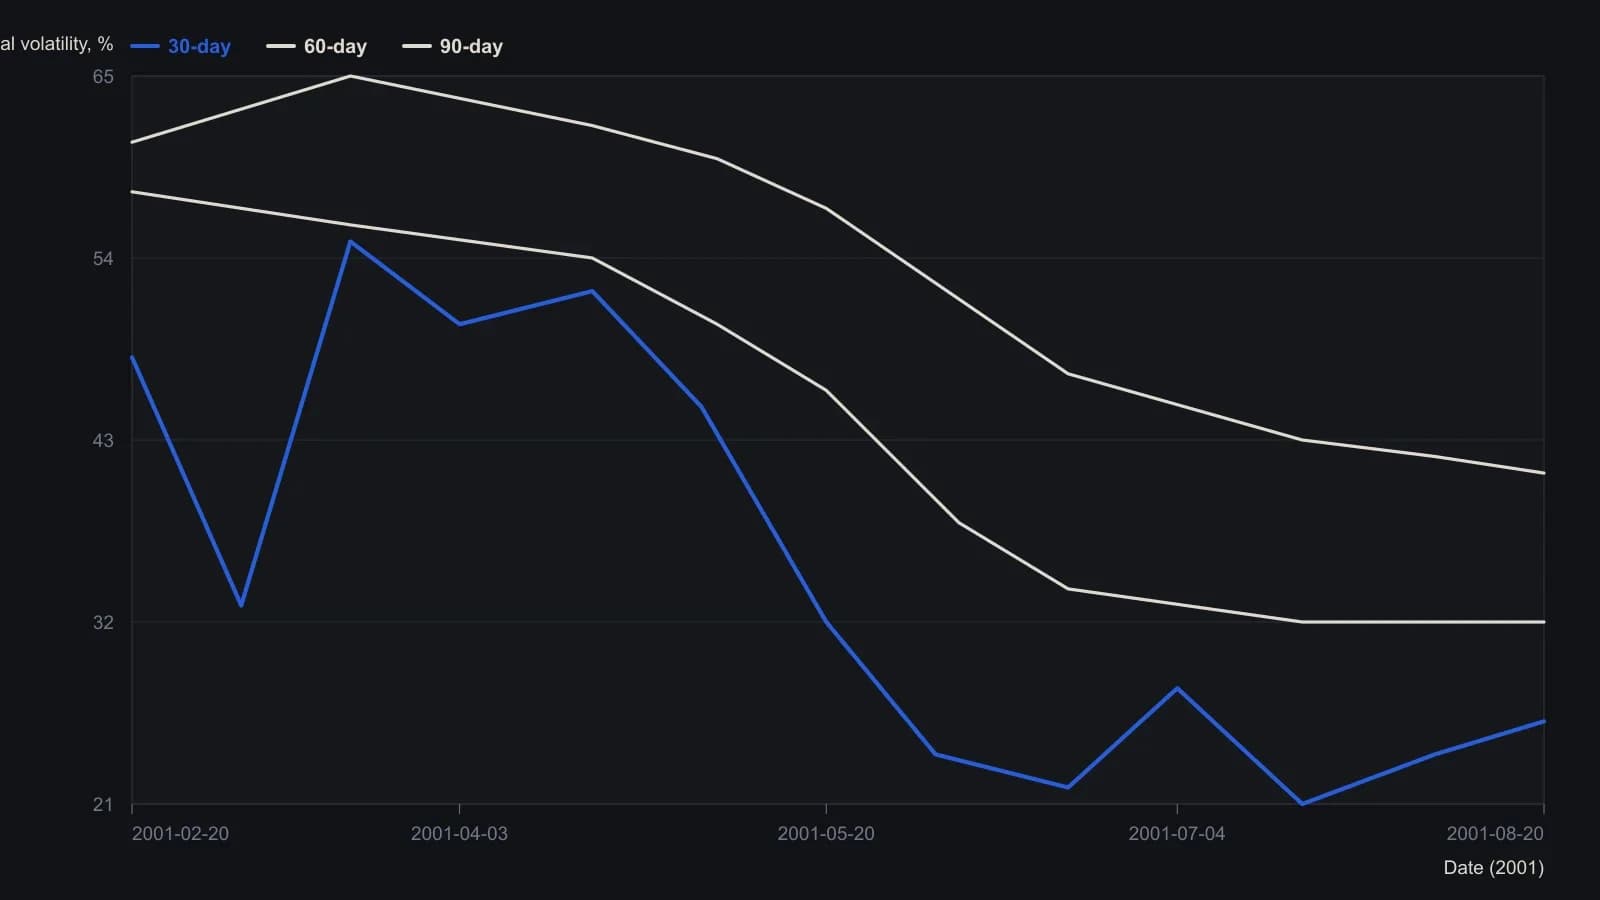
Raster is coarse; values are whole percentage points only. The same screenshot’s quote strip lists the 21 September 2001 60-strike call implied vol at 72.12 percent and the matching put at 23.84 percent (MSQUL). Those implied-vol prints are a single session, not a plotted series, so they are not drawn here.
All readings on this track · 31 readings
- 1985Putting listed option premiums in volatility-regime context
- 1988When volatility, not direction, selects the option spread
- 1988Path-aware volatility for option-replication cost
- 1989Option premium inside a volatility regime
- 1990Constructing consistent historical and implied volatility
- 1991Weekly close-to-close volatility as a horizon filter
- 1995A modified volatility construction for weeks-to-months regimes
- 1996Option smiles as a critique of constant volatility
- 1996Pairing short and long historical volatility for regime context
- 1998Normalized multi-horizon historical volatility construction
- 2001Park one options idea inside an implied and historical volatility regime
- 2002Constructing vertical spreads inside seasonal volatility regimes
- 2002Volatility regime context for option straddles
- 2003Option spread construction with volatility regime checks
- 2003Trend and volatility filters for option spread choice
- 2005Constructing vertical spreads inside volatility regimes
- 2006Implied volatility doubling as a commodity regime signal
- 2007A butterfly reversal call when implied volatility sits near historical volatility
- 2012Evaluate a broken-wing butterfly inside a volatility and premium regime
- 2012Regime-aware equity construction via carry and risk premium
- 2012True range overlays versus isolated bar context
- 2012Constructing regime context for option premium trades
- 2013Construct a ranked volatility switch before the trend filter fires
- 2013Combining Relative Strength Index, historical volatility, and Bollinger %b screens
- 2014A headline equity high is incomplete until the nominal-real spread is read
- 2015Daily implied volatility skew as a portfolio benchmark
- 2015Rebuild a volatility-skew template from size and slope
- 2015Evaluating concentrated winners with volatility and option premiums
- 2017Option book construction from implied volatility, historical volatility and premium
- 2018One-year volatility as the backdrop for short-horizon option trades
- 2019A low-volatility ETF sleeve inside a 2011 to 2019 market-regime case study