1996issue C081-2
Pairing short and long historical volatility for regime context
Historical-volatility is the annualized standard deviation of one-day price changes. Pairing a six-day window with a 100-day window, then dividing the short annualized reading by the long one, places a single contract into faster-versus-slower volatility context.
- Historical-volatility is the annualized standard deviation of one-day price changes and is used here as a market-regime input, not a standalone trade signal.
- Daily percentage changes are log-return values from the natural logarithm of each close divided by the previous close.
- A six-day lookback-window uses five one-day changes and a 100-day window uses 99; both apply the same annualization-factor of the square root of 260 and the same percent scaling.
- The short-to-long-ratio is the six-day annualized reading divided by the 100-day annualized reading.
Two windows on one contract
Historical-volatility is constructed as the annualized standard deviation of one-day price changes on a security or futures contract. It is used here as a market-regime input rather than a standalone trade signal.
Daily percentage changes are obtained as a log-return series: the natural logarithm of each close divided by the previous close. That conversion turns the price series into successive one-day percentage changes.
How the lookback-window is sampled
A lookback-window names the number of sessions in a volatility estimate. A stated span of N days typically supplies N-1 successive one-day changes, so the deviation sample is one observation shorter than the named span.
A six-day lookback contains five one-day changes, so the deviation sample uses five observations rather than six. Reproducing a six-day and 100-day pair required five-period and 99-period standard-deviation windows.
Shared annualization on both windows
The daily deviation is annualized by multiplying by the square root of 260, which is the annualization-factor for an assumed 260 trading-day year, and then scaling by 100 to express a percent rate.
A 100-day annualized reading uses the same 260-day annualization and percent scaling over a 99-change sample from the log-return series. The same annualization-factor and percent scaling are applied to both windows.
Forming the short-to-long-ratio
A short-to-long-ratio is formed by dividing the six-day annualized reading by the 100-day annualized reading. The ratio places one contract into a faster-versus-slower volatility context.
Six-day historical volatility on the sample contract
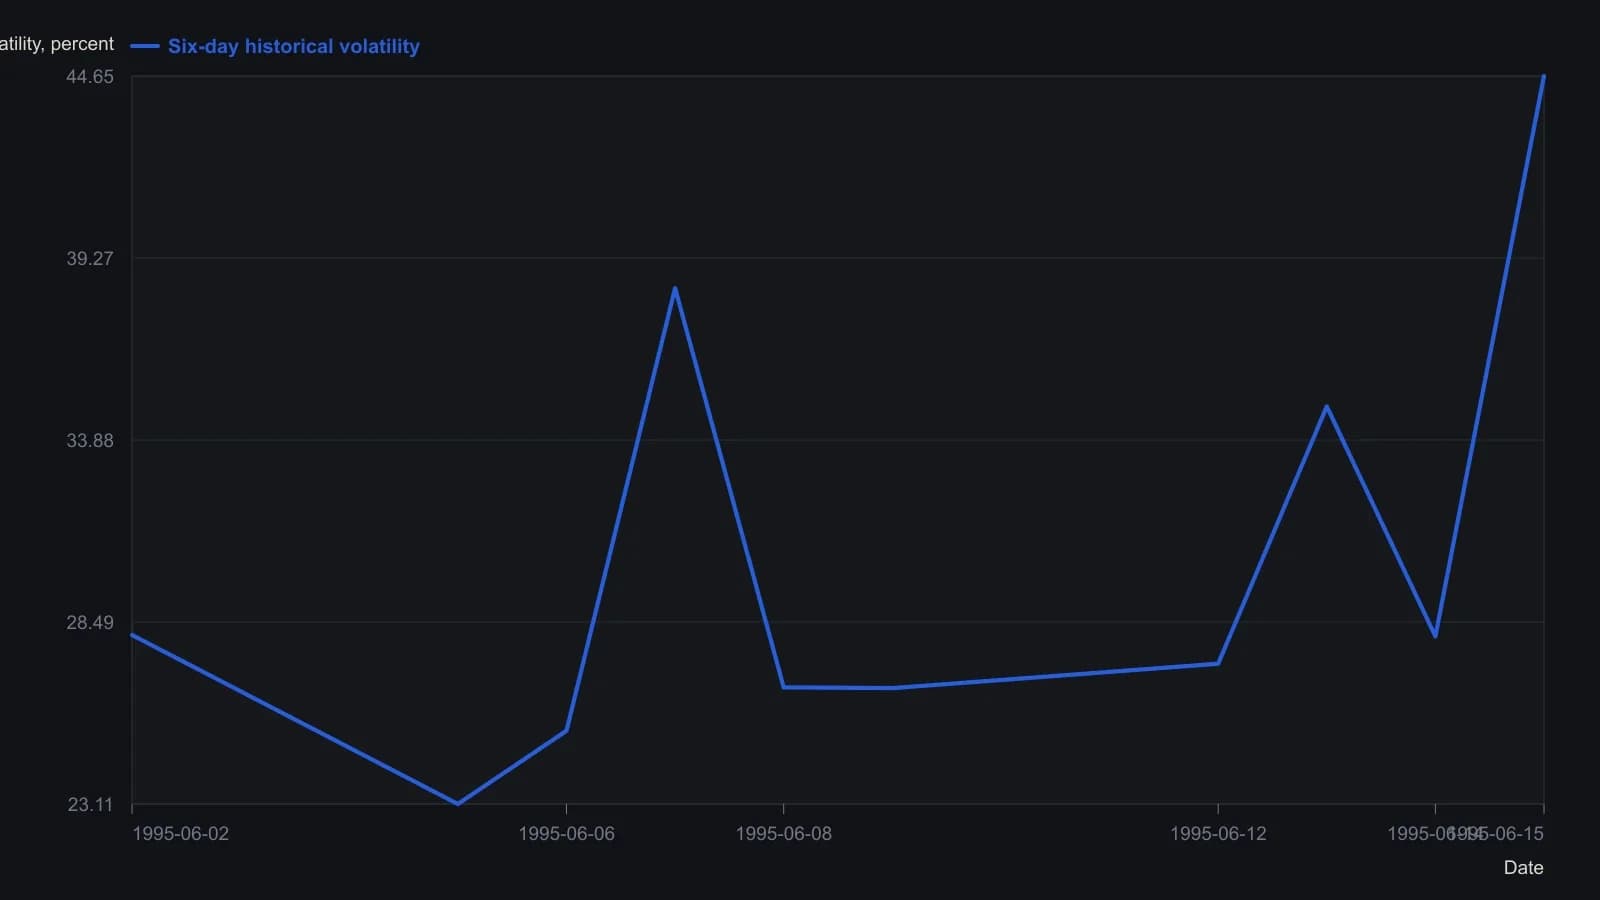
The printed workbook treats a six-day lookback as the sample standard deviation of five one-day log changes, then multiplies by sqrt(260) and by 100. The matching 100-day series was left off the sheet for space, so the short-to-long ratio cannot be plotted from this figure.
Editorial use as regime context
Editorial interpretation: the paired windows do not generate a standalone trade signal. They supply a market-regime reading of whether recent movement on the same contract looks compressed or expanded relative to the slower 100-day baseline.
That reading can sit around an options or futures idea so the single contract is viewed in regime-aware context rather than in isolation.
All readings on this track · 31 readings
- 1985Putting listed option premiums in volatility-regime context
- 1988When volatility, not direction, selects the option spread
- 1988Path-aware volatility for option-replication cost
- 1989Option premium inside a volatility regime
- 1990Constructing consistent historical and implied volatility
- 1991Weekly close-to-close volatility as a horizon filter
- 1995A modified volatility construction for weeks-to-months regimes
- 1996Option smiles as a critique of constant volatility
- 1996Pairing short and long historical volatility for regime context
- 1998Normalized multi-horizon historical volatility construction
- 2001Park one options idea inside an implied and historical volatility regime
- 2002Constructing vertical spreads inside seasonal volatility regimes
- 2002Volatility regime context for option straddles
- 2003Option spread construction with volatility regime checks
- 2003Trend and volatility filters for option spread choice
- 2005Constructing vertical spreads inside volatility regimes
- 2006Implied volatility doubling as a commodity regime signal
- 2007A butterfly reversal call when implied volatility sits near historical volatility
- 2012Evaluate a broken-wing butterfly inside a volatility and premium regime
- 2012Regime-aware equity construction via carry and risk premium
- 2012True range overlays versus isolated bar context
- 2012Constructing regime context for option premium trades
- 2013Construct a ranked volatility switch before the trend filter fires
- 2013Combining Relative Strength Index, historical volatility, and Bollinger %b screens
- 2014A headline equity high is incomplete until the nominal-real spread is read
- 2015Daily implied volatility skew as a portfolio benchmark
- 2015Rebuild a volatility-skew template from size and slope
- 2015Evaluating concentrated winners with volatility and option premiums
- 2017Option book construction from implied volatility, historical volatility and premium
- 2018One-year volatility as the backdrop for short-horizon option trades
- 2019A low-volatility ETF sleeve inside a 2011 to 2019 market-regime case study