2015issue C0234-37
Evaluating concentrated winners with volatility and option premiums
A leftover winner is evaluated as a weeks-to-months regime question. Historical volatility analysis decides which names still hold capital in a pruning-portfolio, then implied volatility analysis and option premium analysis decide whether that concentrated remainder is still a stock risk or a defined-premium exposure.
- Expectancy is framed as giving more influence over typical winner and loser size than over how often each occurs, so the stated control lever is shrinking losers and enlarging winners rather than raising win frequency.
- A pruning-portfolio uses historical volatility analysis to exit names on a volatility stop and reallocate that cash until one holding remains; the comparison window ends when that last name is stopped out.
- Option premium analysis can restate an oversized remainder as a premium-limited exposure by selling the shares and buying long- to medium-term calls, so remaining downside equals the premium paid.
- Vega-stability measures the gap between traded and modeled premiums against vega and checks that the volatility surface has not shifted before the last holding is treated as defined-premium risk.
A leftover winner as a regime question
The archive workflow concentrates a stock book until one name remains. TradersWeek editorial reading treats that remainder as a weeks-to-months market-regime question rather than as an ordinary single-name hold.
Historical volatility analysis times exits and compares multi-condition price paths when capital is redistributed among surviving names. Implied volatility analysis then places the last holding in a weeks-to-months market-regime context using prices, volatility, carry, and portfolio weights. Option premium analysis restates that concentrated stock risk as a premium-limited exposure and tests traded premiums against model premiums and vega.
Expectancy as a size lever
Expectancy is the average contribution of winner and loser size, treated as more controllable than how often each occurs. The archive frames expectancy as giving more influence over typical winner and loser size than over how often each occurs, so the stated control lever is shrinking losers and enlarging winners rather than raising win frequency.
A ten-outcome geometric illustration with nine factors of 1.02 and one factor of 1.30 produces a mean compound result of 1.04504, or 4.50 percent. The illustration shows how one large winner only modestly lifts a field of identical small winners.
Historical volatility analysis in a pruning-portfolio
The comparison drew random 13-name stock books from a multi-year, multi-condition database and ran a fully split reference book beside a pruning-portfolio that concentrated remaining capital.
A pruning-portfolio is a book that exits names on a volatility stop and reallocates that cash into the remaining holdings until one position is left. The pruning book applied a three-average-true-range trailing stop to every name and, after each stop, spread that cash evenly across the survivors until one holding remained. The comparison window ended when that last name was stopped out.
Pruning portfolio vs diversified reference
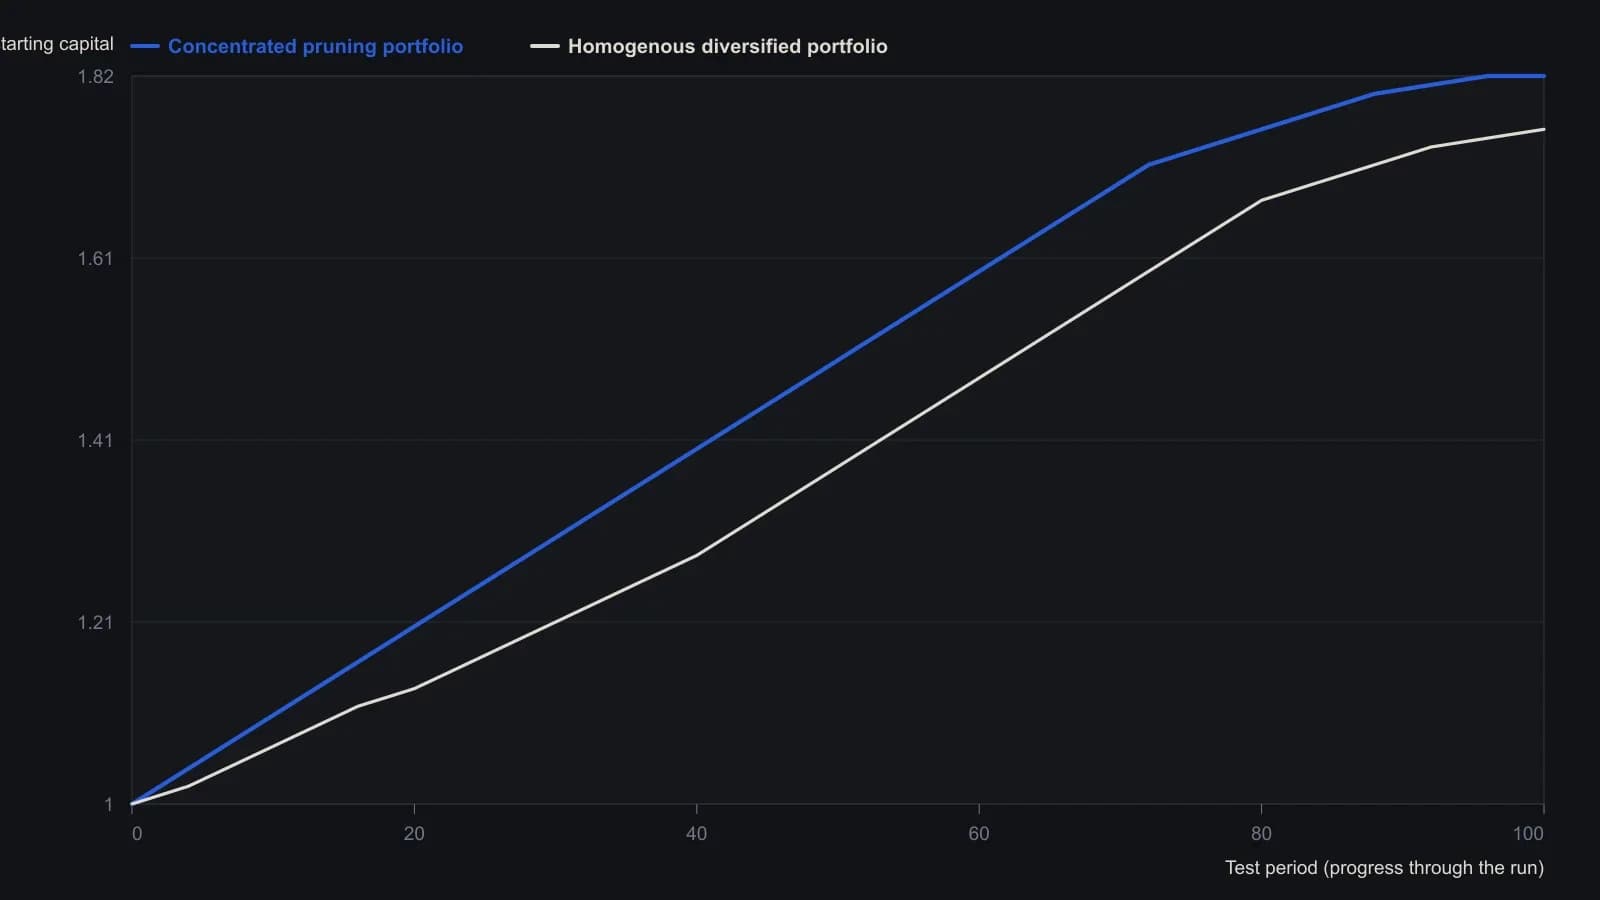
Y-axis is the article’s equity multiple (starting near 1.0). Digitized from the printed Figure 1; series are approximate and were subsampled along the time axis. Gray individual-stock paths that die mid-test are omitted so the comparison stays on the two books the article highlights.
Overnight gap risk after concentration
A worked overnight-gap case states that a position grown to 180 percent of capital that opens 40 percent lower would lose 72 percent of total equity, illustrating a gap that a stop cannot catch.
TradersWeek editorial reading: historical volatility analysis can time an exit on traded range, but the gap case shows that a stop does not remove overnight gap risk once capital has been concentrated into one leftover winner.
Restating concentrated stock risk as premium
One described response to an oversized winner is to sell the shares and buy long- to medium-term calls so remaining downside equals the premium paid.
In the substitution arithmetic, 900 shares at 30 dollars become 27,000 dollars of cash, of which 3,000 dollars buys 30 call contracts, or 11.11 percent of the original position value. Option premium analysis uses that restatement so the concentrated remainder is no longer an open-ended stock risk.
Implied volatility analysis and vega-stability
Implied volatility analysis places the remaining holding in a weeks-to-months market-regime context using prices, volatility, carry, and portfolio weights. Option premium analysis then tests whether that substitution is still a stable premium-limited exposure.
Side-by-side premium tests report large differences between traded and calculated premiums relative to vega, with only near-at-the-money gaps staying under 20 percent versus vega, and the May 2014 expiration marked as a loss of model stability. Vega-stability is the gap between traded and modeled premiums measured against vega, used as a check that the volatility surface has not shifted.
All readings on this track · 31 readings
- 1985Putting listed option premiums in volatility-regime context
- 1988When volatility, not direction, selects the option spread
- 1988Path-aware volatility for option-replication cost
- 1989Option premium inside a volatility regime
- 1990Constructing consistent historical and implied volatility
- 1991Weekly close-to-close volatility as a horizon filter
- 1995A modified volatility construction for weeks-to-months regimes
- 1996Option smiles as a critique of constant volatility
- 1996Pairing short and long historical volatility for regime context
- 1998Normalized multi-horizon historical volatility construction
- 2001Park one options idea inside an implied and historical volatility regime
- 2002Constructing vertical spreads inside seasonal volatility regimes
- 2002Volatility regime context for option straddles
- 2003Option spread construction with volatility regime checks
- 2003Trend and volatility filters for option spread choice
- 2005Constructing vertical spreads inside volatility regimes
- 2006Implied volatility doubling as a commodity regime signal
- 2007A butterfly reversal call when implied volatility sits near historical volatility
- 2012Evaluate a broken-wing butterfly inside a volatility and premium regime
- 2012Regime-aware equity construction via carry and risk premium
- 2012True range overlays versus isolated bar context
- 2012Constructing regime context for option premium trades
- 2013Construct a ranked volatility switch before the trend filter fires
- 2013Combining Relative Strength Index, historical volatility, and Bollinger %b screens
- 2014A headline equity high is incomplete until the nominal-real spread is read
- 2015Daily implied volatility skew as a portfolio benchmark
- 2015Rebuild a volatility-skew template from size and slope
- 2015Evaluating concentrated winners with volatility and option premiums
- 2017Option book construction from implied volatility, historical volatility and premium
- 2018One-year volatility as the backdrop for short-horizon option trades
- 2019A low-volatility ETF sleeve inside a 2011 to 2019 market-regime case study