1990issue C101-10
Constructing consistent historical and implied volatility
A single options overlay belongs in a diversified, regime-aware book only when historical and implied volatility share one internally consistent ruler. Keep the estimator, sample length, and annualization fixed, and do not mix incompatible formulas or vendor series.
- Historical volatility describes past price dispersion around a norm; implied volatility is the forward-looking level embedded in current option premiums.
- Comparable regime readings require estimator-consistency, because series built with different formulas or data services are not automatically comparable.
- The sample standard deviation of closing prices has price-level-bias, so a preferred historical construction uses log-return-dispersion with divisor n-1 and then annualizes.
- A more reliable implied reading uses liquid, at- or near-the-money options with more than one month of remaining life, combined with one stated implied-volatility-weighting rule.
One volatility ruler
A diversified, regime-aware book needs one internally consistent volatility ruler before a single options overlay is placed in it. Historical volatility is a backward-looking reading of how widely a security's price or return has dispersed over a chosen sample window. Implied volatility is the forward-looking volatility that makes a pricing model's theoretical option value match the option's current market premium.
Historical dispersion answers where prices have been. Implied dispersion answers what listed premiums now assume. Absolute price swings and percentage-based dispersion can disagree because they measure different quantities.
Window, estimator, and price-level-bias
A volatility reading depends on both the lookback window and the estimator. A longer window is statistically more stable. A shorter window closer to the decision tracks recent price behavior more closely.
The sample standard deviation of closing prices scales with the price level, so doubling all prices doubles the reading and makes multiperiod comparison meaningless unless the series is first normalized and, if the sample is shorter than a year, annualized. That defect is price-level-bias.
A preferred historical construction
A preferred historical construction uses the unbiased sample standard deviation of log close-to-close ratios, with divisor n-1, then annualizes daily readings by the square root of 252 and weekly readings by the square root of 52. That construction is log-return-dispersion. It does not inflate merely because the price level rose.
Annualization scales a sub-year sample into a yearly standard-deviation unit. Under that annualized lognormal reading, a volatility of 0.12 around a price of 100 corresponds to a one-standard-deviation band of 88 to 112 over twelve months, framed as covering about 68 percent of outcomes. A two-standard-deviation band is framed as covering about 95 percent of outcomes.
Range-based construction
A high-low range construction replaces sequential closes with the period high and low, scales the log ratio by 0.601, averages those period readings, and annualizes. This range-based-estimator is interpreted like log-price dispersion but adds complexity without a new use.
20-day standard deviation of S&P 100 daily closes, August 1988–September 1989
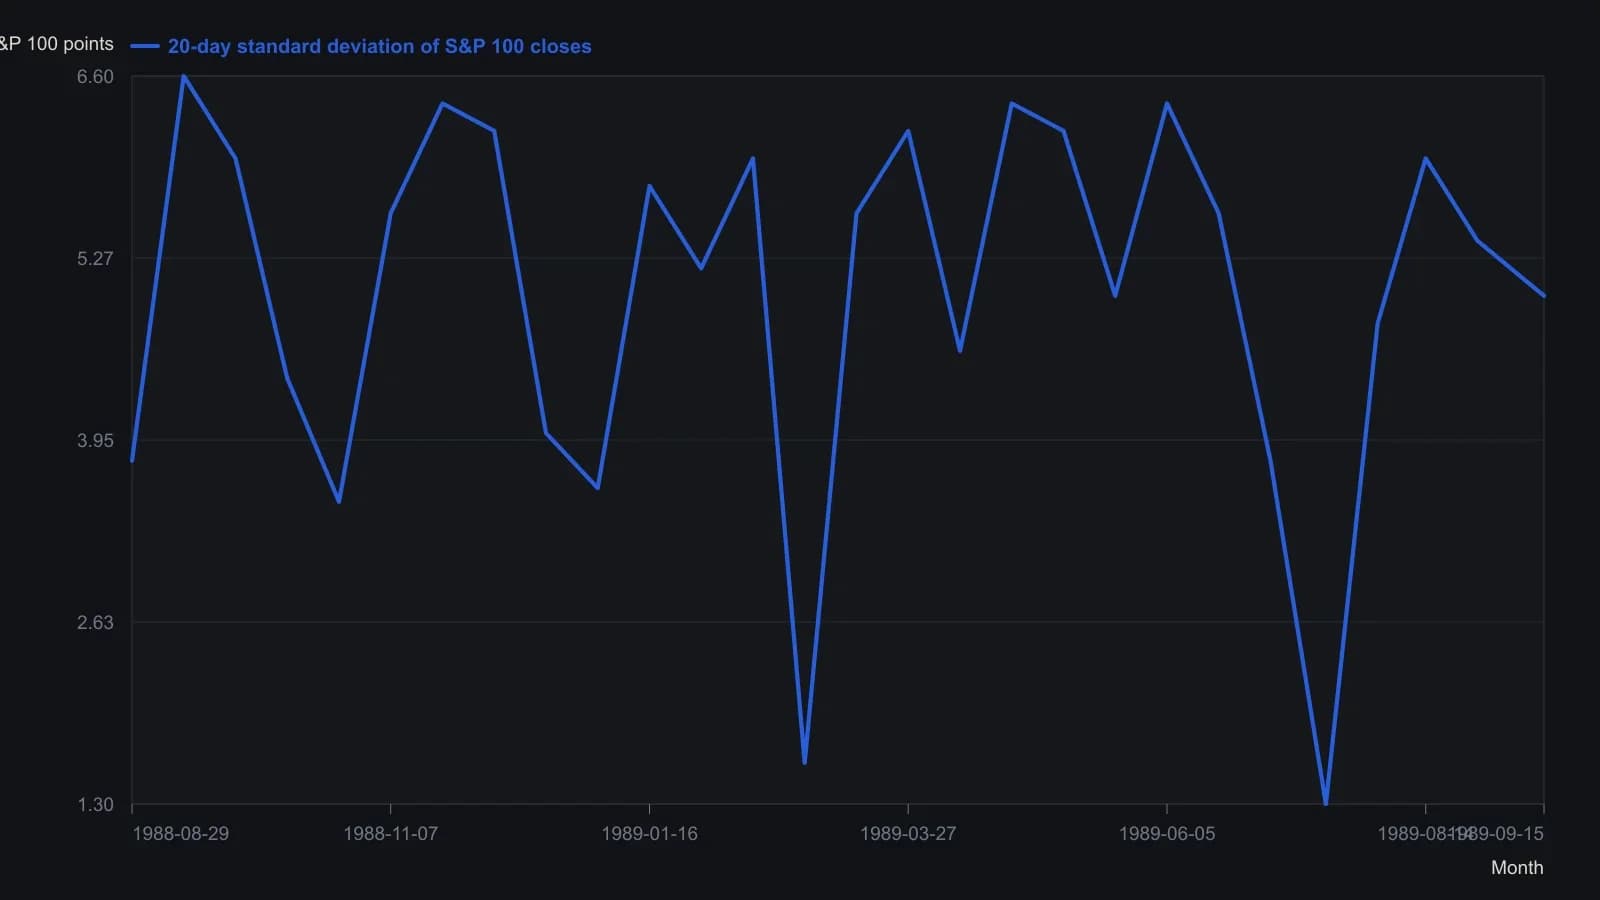
The source uses an unbiased 20-day standard deviation of closing levels (denominator n−1). It warns that doubling the price level doubles this reading, so the series is not comparable across periods and should not enter an option model unless it is first divided by the window’s average price and then annualized.
Implied volatility from listed premiums
Implied volatility is obtained by iterating a pricing model until theoretical value equals the live premium, holding other inputs fixed.
A more reliable implied-volatility input set uses liquid, at- or near-the-money options with more than one month of remaining life, then combines those readings with one stated implied-volatility-weighting rule based on volume, moneyness, or price sensitivity to volatility. Different weighting rules need not produce comparable estimates.
Editorial reading for a diversified book
Editorial interpretation: keep historical dispersion and implied dispersion on this single ruler when a single options overlay is placed inside a diversified or regime-aware book. Use the historical series for where prices have been and the implied series for what listed premiums now assume. Do not mix incompatible formulas or vendor series.
All readings on this track · 31 readings
- 1985Putting listed option premiums in volatility-regime context
- 1988When volatility, not direction, selects the option spread
- 1988Path-aware volatility for option-replication cost
- 1989Option premium inside a volatility regime
- 1990Constructing consistent historical and implied volatility
- 1991Weekly close-to-close volatility as a horizon filter
- 1995A modified volatility construction for weeks-to-months regimes
- 1996Option smiles as a critique of constant volatility
- 1996Pairing short and long historical volatility for regime context
- 1998Normalized multi-horizon historical volatility construction
- 2001Park one options idea inside an implied and historical volatility regime
- 2002Constructing vertical spreads inside seasonal volatility regimes
- 2002Volatility regime context for option straddles
- 2003Option spread construction with volatility regime checks
- 2003Trend and volatility filters for option spread choice
- 2005Constructing vertical spreads inside volatility regimes
- 2006Implied volatility doubling as a commodity regime signal
- 2007A butterfly reversal call when implied volatility sits near historical volatility
- 2012Evaluate a broken-wing butterfly inside a volatility and premium regime
- 2012Regime-aware equity construction via carry and risk premium
- 2012True range overlays versus isolated bar context
- 2012Constructing regime context for option premium trades
- 2013Construct a ranked volatility switch before the trend filter fires
- 2013Combining Relative Strength Index, historical volatility, and Bollinger %b screens
- 2014A headline equity high is incomplete until the nominal-real spread is read
- 2015Daily implied volatility skew as a portfolio benchmark
- 2015Rebuild a volatility-skew template from size and slope
- 2015Evaluating concentrated winners with volatility and option premiums
- 2017Option book construction from implied volatility, historical volatility and premium
- 2018One-year volatility as the backdrop for short-horizon option trades
- 2019A low-volatility ETF sleeve inside a 2011 to 2019 market-regime case study