2006issue C071-7
Implied volatility doubling as a commodity regime signal
Archive notes on soybeans show implied volatility rising from 25% in May 2005 to 50% in July 2005, after which the prior futures advance reversed. TradersWeek editorial: treat that 100% increase as a market-regime checkpoint that starts by comparing option premium with historical volatility.
- Implied volatility is treated here as a chart-readable supply-and-demand measure of option premium and as a market-regime gauge, not as a pricing formula.
- In the soybean case, implied volatility rose from 25% in May 2005 to 50% in July 2005, after which the February-to-July futures advance reversed and the September 2005 $8 out-of-the-money call expired worthless.
- Backtests across several commodities associated a 100% implied-volatility increase with a pause or reversal of the prevailing futures trend, except when war or severe weather intervened.
- TradersWeek editorial: use that doubling as a checkpoint that starts by comparing option premium with historical volatility before judging whether a commodity trend is exhausted.
Implied volatility as a regime gauge
In the archive notes, implied volatility is framed as a supply-and-demand measure of option premium that can be read from charts without solving the pricing mathematics. The working definition here is the option-implied estimate of expected movement, used as a market-regime gauge rather than a pricing formula.
The soybean doubling in 2005
In the soybean case, implied volatility rose from 25% in May 2005 to 50% in July 2005, a 100% increase. After that doubling, the soybean futures advance that had run from February 2005 to July 2005 reversed and prices declined.
The September 2005 soybean $8 out-of-the-money call expired worthless after implied volatility doubled.
Backtests across several commodities associated a 100% implied-volatility increase with a pause or reversal of the prevailing futures trend, except when external shocks such as war or severe weather intervened.
Soybean futures reversed after implied volatility doubled
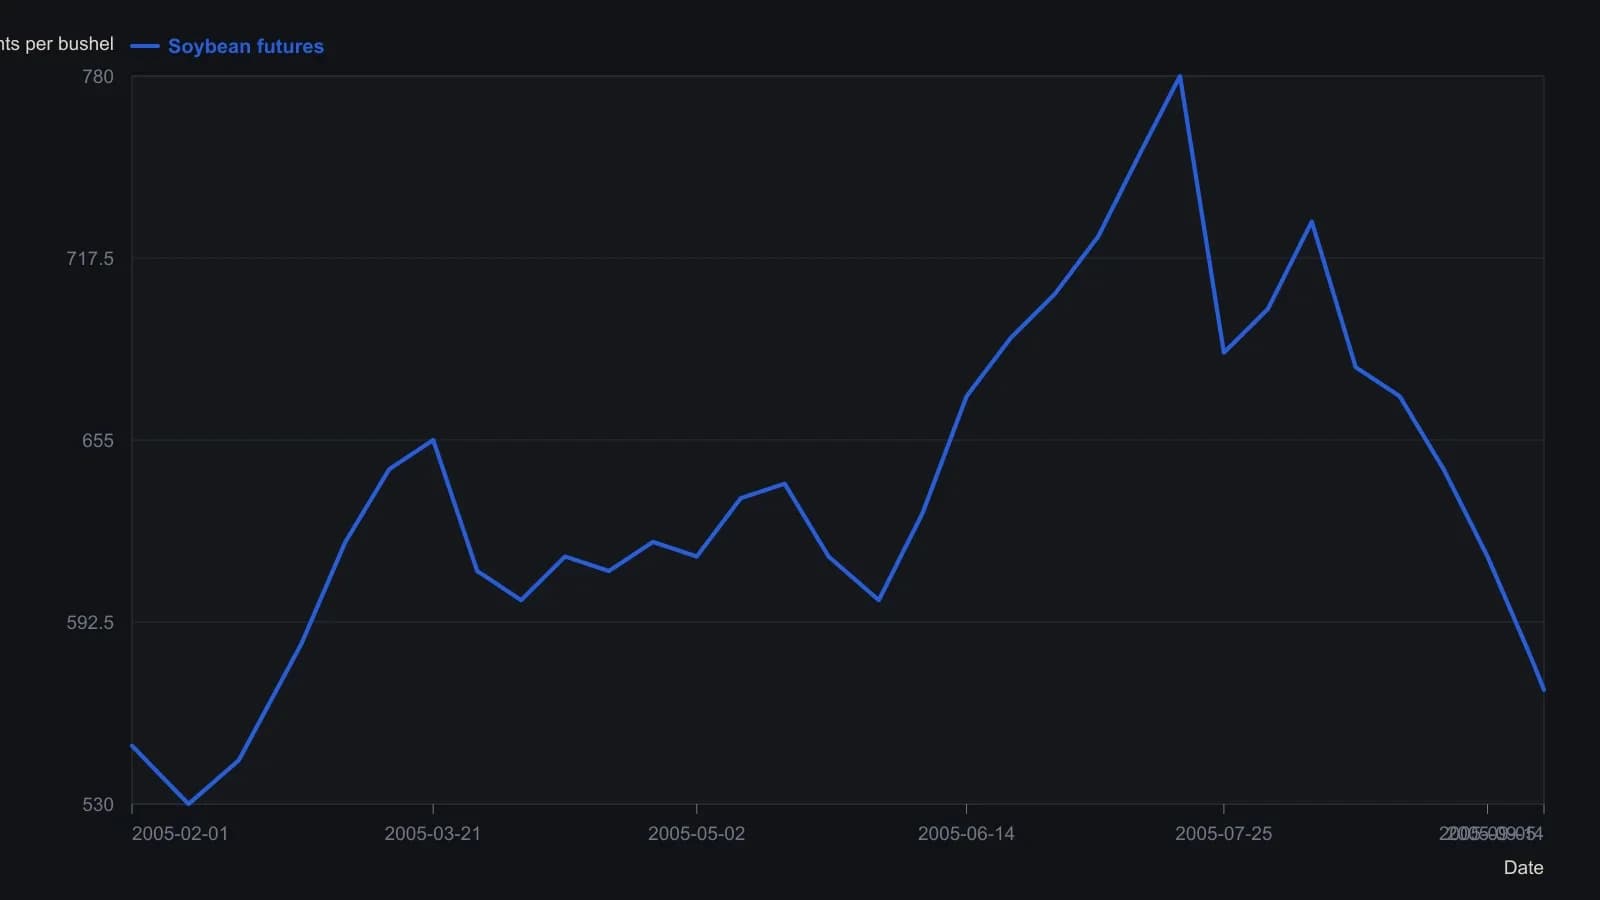
Y-values other than the 14 September 2005 close of 569.2 are approximate to the nearest five cents. The source notes that a minority of 100% implied-volatility jumps fail to reverse when war or extreme weather dominates.
Other implied-volatility charts
A two-year lumber implied-volatility chart was shown with an implied-volatility close of 19.7% on 4/21/06. A two-year soybean implied-volatility chart was shown with an implied-volatility close of 23.1% on 1/21/06.
A two-year S&P 500 implied-volatility chart dated 4/21/06 closed at 10.9% and was described as opposite to the commodity examples, with resistance marking the end of a pullback.
Crude oil at archive time
The archive notes, at the time they were written, said crude-oil futures were rising while implied volatility was falling or not expanding to the levels seen during Katrina.
Comparing premium with historical volatility
TradersWeek editorial: option-premium analysis means reading whether option prices have become expensive or cheap relative to the current implied-volatility regime. Historical volatility is the realized price variability used as a baseline for judging whether implied volatility looks stretched.
TradersWeek editorial uses froth as a teaching metaphor for excess option premium that can evaporate after implied volatility expands sharply. In the archive soybean case, that evaporation is the September 2005 $8 out-of-the-money call expiring worthless after implied volatility doubled.
All readings on this track · 31 readings
- 1985Putting listed option premiums in volatility-regime context
- 1988When volatility, not direction, selects the option spread
- 1988Path-aware volatility for option-replication cost
- 1989Option premium inside a volatility regime
- 1990Constructing consistent historical and implied volatility
- 1991Weekly close-to-close volatility as a horizon filter
- 1995A modified volatility construction for weeks-to-months regimes
- 1996Option smiles as a critique of constant volatility
- 1996Pairing short and long historical volatility for regime context
- 1998Normalized multi-horizon historical volatility construction
- 2001Park one options idea inside an implied and historical volatility regime
- 2002Constructing vertical spreads inside seasonal volatility regimes
- 2002Volatility regime context for option straddles
- 2003Option spread construction with volatility regime checks
- 2003Trend and volatility filters for option spread choice
- 2005Constructing vertical spreads inside volatility regimes
- 2006Implied volatility doubling as a commodity regime signal
- 2007A butterfly reversal call when implied volatility sits near historical volatility
- 2012Evaluate a broken-wing butterfly inside a volatility and premium regime
- 2012Regime-aware equity construction via carry and risk premium
- 2012True range overlays versus isolated bar context
- 2012Constructing regime context for option premium trades
- 2013Construct a ranked volatility switch before the trend filter fires
- 2013Combining Relative Strength Index, historical volatility, and Bollinger %b screens
- 2014A headline equity high is incomplete until the nominal-real spread is read
- 2015Daily implied volatility skew as a portfolio benchmark
- 2015Rebuild a volatility-skew template from size and slope
- 2015Evaluating concentrated winners with volatility and option premiums
- 2017Option book construction from implied volatility, historical volatility and premium
- 2018One-year volatility as the backdrop for short-horizon option trades
- 2019A low-volatility ETF sleeve inside a 2011 to 2019 market-regime case study