2013issue C0949-53
Combining Relative Strength Index, historical volatility, and Bollinger %b screens
A live technical screener can refresh short-lookback Relative Strength Index readings, historical volatility, and Bollinger %b on the 3,500 most liquid US-listed stocks and exchange-traded funds. Liquidity and trend-context rules come first, then oscillator extremes are stacked with volatility-regime and band-position readings rather than used alone.
- Apply a liquidity and trend-context filter, including average daily volume of at least 500,000 shares, a price above five dollars, and a close above the 200-day moving average, before any oscillator or volatility rule.
- Stack two-day and four-day Relative Strength Index extremes with short-horizon returns and a five-day stretch from a simple moving average.
- Inspect Bollinger Bands %b together with Relative Strength Index and 100-day historical volatility before treating a short-horizon extreme as possible swing exhaustion.
- The same Relative Strength Index, %b, and historical-volatility stack can be inverted to time short-horizon fade attempts inside an already identified bullish trend.
What the screener can refresh
A live technical screener can refresh two-day and four-day Relative Strength Index readings, 10-day and 100-day historical volatility, and Bollinger %b on a universe of the 3,500 most liquid US-listed stocks and exchange-traded funds.
The same screening surface also exposes consecutive up and down closes, two-day and five-day percentage returns, and a five-day stretch from a simple moving average, so oscillator extremes can be stacked with short-horizon price-path filters.
Liquidity and trend context first
A saved liquidity and trend-context filter can require average daily volume of at least 500,000 shares, a price above five dollars, and a close above the 200-day moving average before any oscillator or volatility rule is applied.
A documented oversold combination
One documented oversold combination on S&P 500 components stacked a two-day Relative Strength Index of 10 or lower, a four-day Relative Strength Index of 20 or lower, a two-day return of minus 5 percent or worse, and a five-day stretch of minus 7 percent or more below the five-day average.
Band position and volatility as a second look
Bollinger %b is presented as a dedicated band-position reading that can be inspected together with Relative Strength Index and 100-day historical volatility before treating a short-horizon extreme as a possible swing exhaustion.
High 10-day historical volatility can be paired with Relative Strength Index and %b as a second-pass regime check when a trader is deciding whether a screened move looks like the start or continuation of a trend rather than a finished swing.
Review after a name screens
Follow-up review of a screened name can add a 10-day ADX reading, the 50-day and 200-day moving-average location, Relative Strength Index, %b, a short-horizon momentum oscillator, and 100-day historical volatility rather than acting on a single indicator print.
The inverted stack
The same Relative Strength Index, %b, and historical-volatility stack can be inverted to time short-horizon fade attempts inside an already identified bullish trend, instead of only hunting oversold entries.
ConnorsRSI for the eight names that cleared the oversold stack
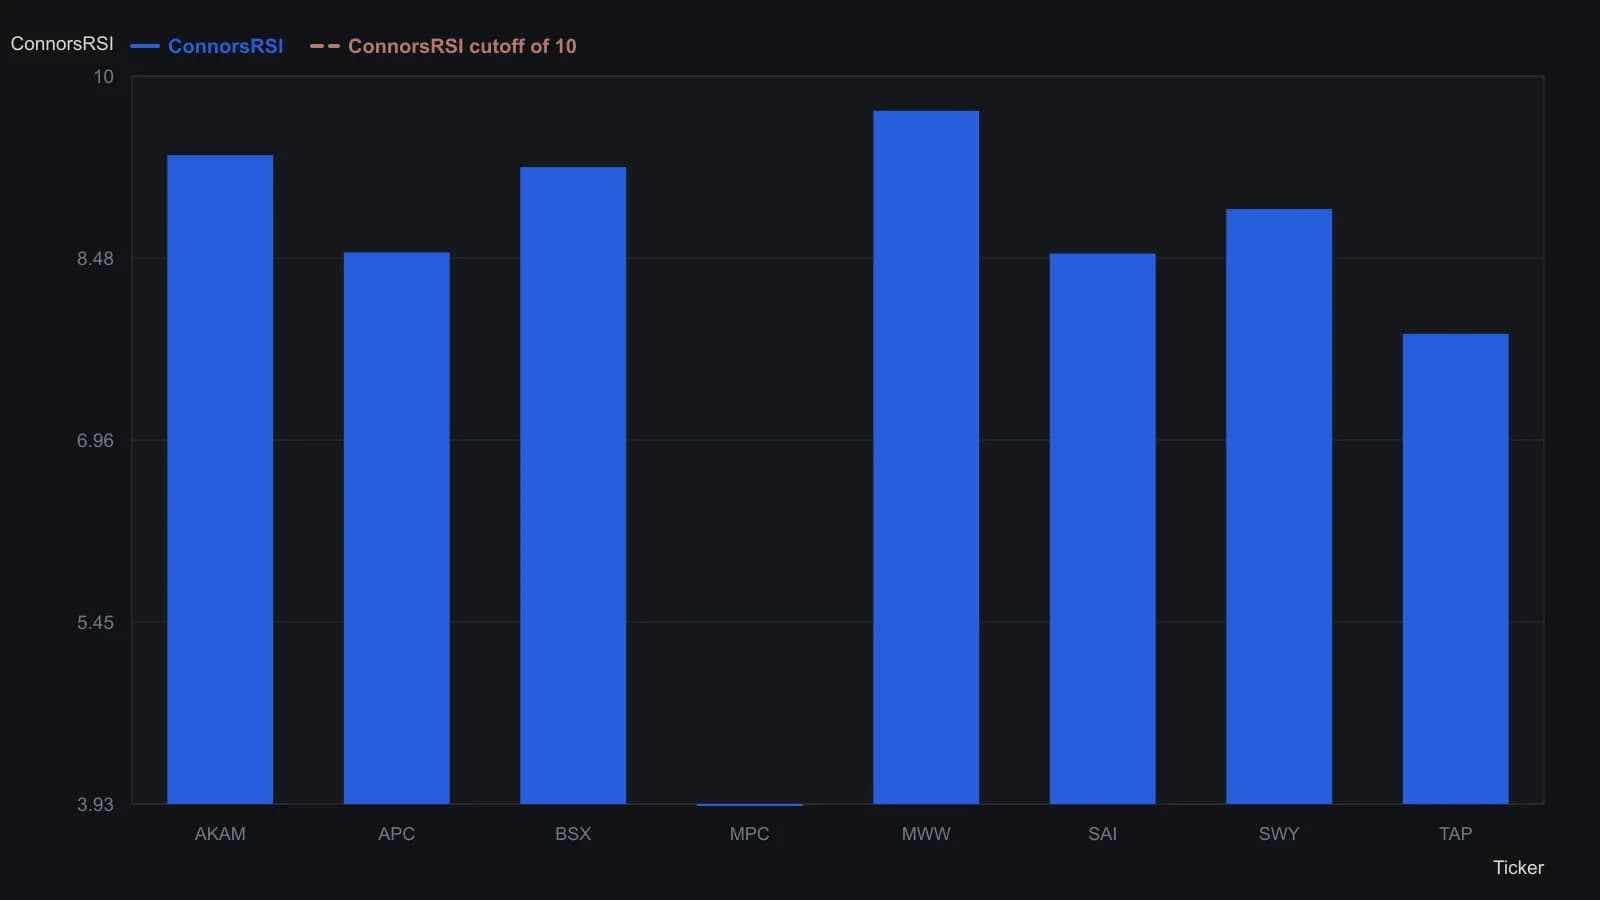
The reviewer ran the screen late on Thursday, June 20, 2013 against S&P 500 members with average volume of 500k or more, price above $5, price above the 200-day moving average, 100-day historical volatility between 25 and 50, three or more consecutive lower closes, and ConnorsRSI of 10 or below.
All readings on this track · 31 readings
- 1985Putting listed option premiums in volatility-regime context
- 1988When volatility, not direction, selects the option spread
- 1988Path-aware volatility for option-replication cost
- 1989Option premium inside a volatility regime
- 1990Constructing consistent historical and implied volatility
- 1991Weekly close-to-close volatility as a horizon filter
- 1995A modified volatility construction for weeks-to-months regimes
- 1996Option smiles as a critique of constant volatility
- 1996Pairing short and long historical volatility for regime context
- 1998Normalized multi-horizon historical volatility construction
- 2001Park one options idea inside an implied and historical volatility regime
- 2002Constructing vertical spreads inside seasonal volatility regimes
- 2002Volatility regime context for option straddles
- 2003Option spread construction with volatility regime checks
- 2003Trend and volatility filters for option spread choice
- 2005Constructing vertical spreads inside volatility regimes
- 2006Implied volatility doubling as a commodity regime signal
- 2007A butterfly reversal call when implied volatility sits near historical volatility
- 2012Evaluate a broken-wing butterfly inside a volatility and premium regime
- 2012Regime-aware equity construction via carry and risk premium
- 2012True range overlays versus isolated bar context
- 2012Constructing regime context for option premium trades
- 2013Construct a ranked volatility switch before the trend filter fires
- 2013Combining Relative Strength Index, historical volatility, and Bollinger %b screens
- 2014A headline equity high is incomplete until the nominal-real spread is read
- 2015Daily implied volatility skew as a portfolio benchmark
- 2015Rebuild a volatility-skew template from size and slope
- 2015Evaluating concentrated winners with volatility and option premiums
- 2017Option book construction from implied volatility, historical volatility and premium
- 2018One-year volatility as the backdrop for short-horizon option trades
- 2019A low-volatility ETF sleeve inside a 2011 to 2019 market-regime case study