2019issue C0726-30
A low-volatility ETF sleeve inside a 2011 to 2019 market-regime case study
From 2011 through 2019 a U.S. minimum-volatility sleeve nearly kept pace with a broad S&P 500 proxy, while factor ranks, a relative-strength-switch, and 2018 drawdowns showed the quieter sleeve moving through strong and weak regimes.
- From 2011 through 2019 a U.S. minimum-volatility sleeve gained 172.3% against 179.4% for a broad S&P 500 proxy, so the quieter sleeve nearly kept pace through a long bull stretch.
- A monthly relative-strength-switch based on six-month returns between that sleeve and the same proxy produced 170.40% versus 169.20% total return, 11.50% versus 12.80% volatility, a 1.17 versus 1.05 Sharpe ratio, and a 15.30% versus 19.30% maximum drawdown.
- Across a U.S. large-cap factor set from 2008 through 2014, low volatility ranked first in 2008, 2011, and 2014, fifth in 2009, and last in 2010, 2012, and 2013, so the factor rotated through strong and weak regimes.
- In the February 2018 and late-2018 routs, a utilities sleeve was roughly flat at +0.21% while the minimum-volatility sleeve fell 11.95% and the S&P 500 proxy fell 18.91%.
What the quieter sleeve is
A low-volatility ETF is an exchange-traded fund that systematically overweight stocks with historically quieter price swings. Historical-volatility is past realized price variation used to rank stocks, funds, or market regimes. Volatility-targeting means sizing or selecting a sleeve so realized volatility and drawdown stay below a broader market proxy.
Keeping pace with a broad-market proxy
In a 2011 to 2019 comparison, a U.S. minimum-volatility sleeve gained 172.3% while a broad S&P 500 proxy gained 179.4%, so the quieter sleeve nearly kept pace through a long bull stretch. From October 2011 through April 2019 the same minimum-volatility sleeve gained 172.3% versus 121.42% for utilities and 179.39% for the S&P 500 proxy, placing the volatility-targeted sleeve between a defensive sector and the broad market.
A monthly relative-strength-switch
A relative-strength-switch is a rules-based monthly choice between two funds based on the prior six-month return. A six-month relative-strength switch reviewed monthly between that minimum-volatility sleeve and the same S&P 500 proxy produced 170.40% versus 169.20% total return, 11.50% versus 12.80% volatility, a 1.17 versus 1.05 Sharpe ratio, and a 15.30% versus 19.30% maximum drawdown.
Factor-rotation and category size
Factor-rotation is the tendency of style tilts such as low volatility to lead in some calendar years and lag in others. Across a U.S. large-cap factor set from 2008 through 2014, low volatility ranked first in 2008, 2011, and 2014, fifth in 2009, and last in 2010, 2012, and 2013, so the factor itself rotated through strong and weak regimes. By April 2019 the tracked low-volatility ETF slice held about $65.8 billion across 27 funds, with the three largest names concentrating roughly $46 billion versus $16 billion in the next eight.
Defensive sleeves and the 2018 routs
From late 2015 through April 2019, a utilities sleeve rose 50.4% versus 50.5% for a broad S&P 500 proxy, while consumer staples and REIT sleeves rose only about 21%, showing defensive tilts did not move as one block when policy rates were rising. In the February 2018 and late-2018 market routs, the utilities sleeve was roughly flat at +0.21% while the minimum-volatility sleeve fell 11.95% and the S&P 500 proxy fell 18.91%, so lower historical volatility still left a sizable drawdown versus a single defensive sector.
USMV versus SPY cumulative return, 2011–2019
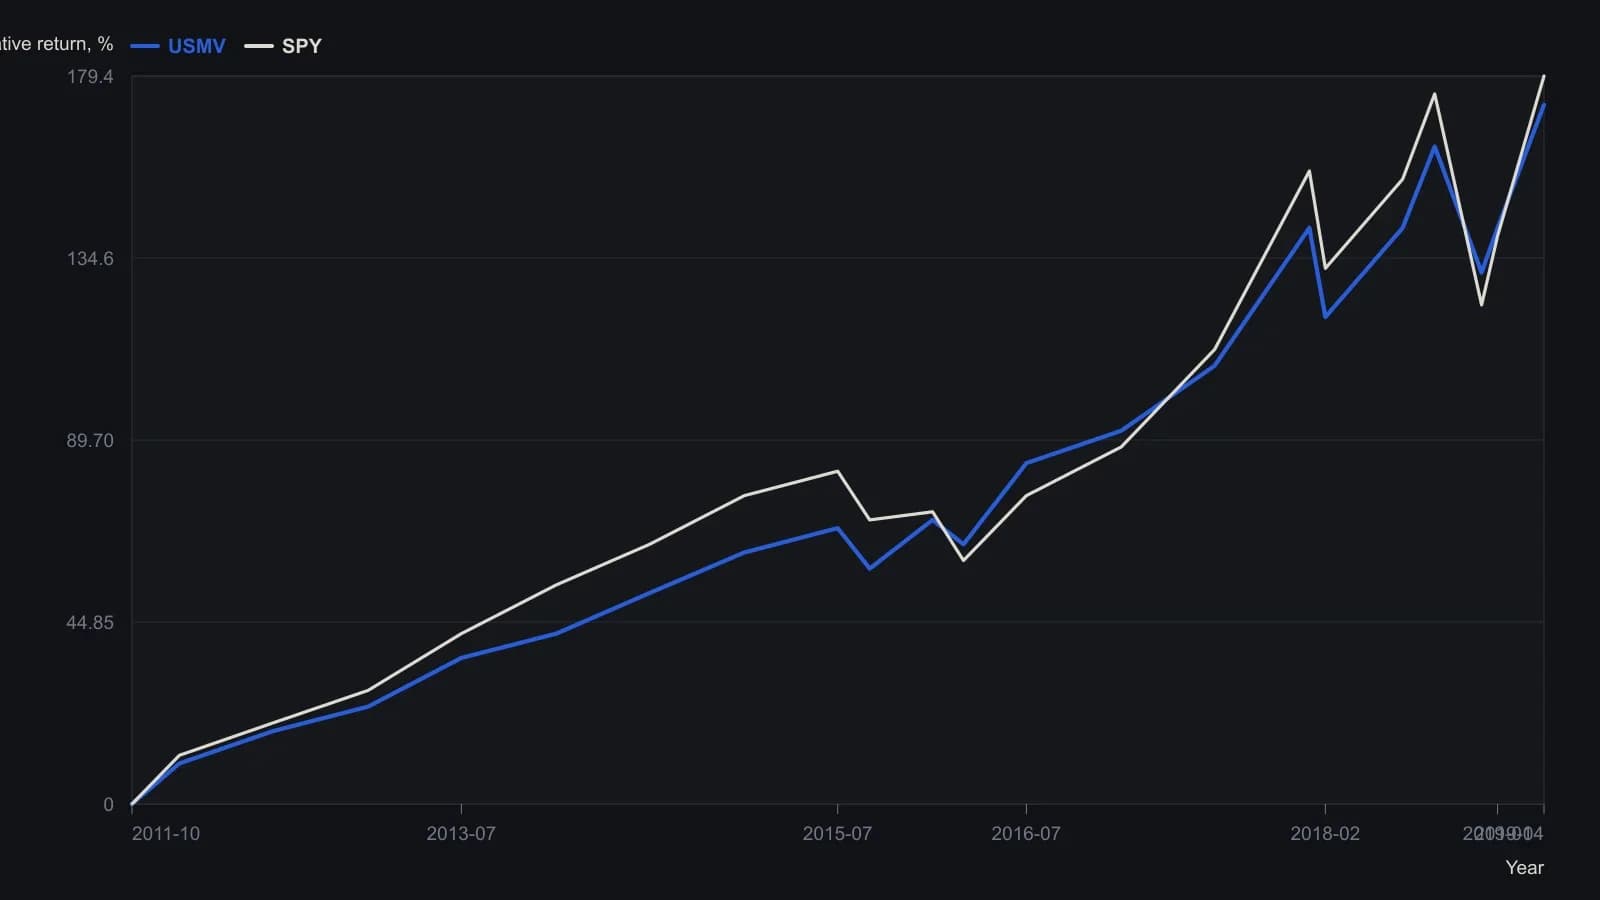
Cumulative percent change from 20 October 2011 through 25 April 2019. Intermediate readings are approximate to the nearest percent from the printed 10% grid. Terminal values of 172.3% (USMV) and 179.4% (SPY) come from the article text, as do the late-2018 window declines used to place the December 2018 troughs (USMV −11.95%, SPY −18.91%).
All readings on this track · 31 readings
- 1985Putting listed option premiums in volatility-regime context
- 1988When volatility, not direction, selects the option spread
- 1988Path-aware volatility for option-replication cost
- 1989Option premium inside a volatility regime
- 1990Constructing consistent historical and implied volatility
- 1991Weekly close-to-close volatility as a horizon filter
- 1995A modified volatility construction for weeks-to-months regimes
- 1996Option smiles as a critique of constant volatility
- 1996Pairing short and long historical volatility for regime context
- 1998Normalized multi-horizon historical volatility construction
- 2001Park one options idea inside an implied and historical volatility regime
- 2002Constructing vertical spreads inside seasonal volatility regimes
- 2002Volatility regime context for option straddles
- 2003Option spread construction with volatility regime checks
- 2003Trend and volatility filters for option spread choice
- 2005Constructing vertical spreads inside volatility regimes
- 2006Implied volatility doubling as a commodity regime signal
- 2007A butterfly reversal call when implied volatility sits near historical volatility
- 2012Evaluate a broken-wing butterfly inside a volatility and premium regime
- 2012Regime-aware equity construction via carry and risk premium
- 2012True range overlays versus isolated bar context
- 2012Constructing regime context for option premium trades
- 2013Construct a ranked volatility switch before the trend filter fires
- 2013Combining Relative Strength Index, historical volatility, and Bollinger %b screens
- 2014A headline equity high is incomplete until the nominal-real spread is read
- 2015Daily implied volatility skew as a portfolio benchmark
- 2015Rebuild a volatility-skew template from size and slope
- 2015Evaluating concentrated winners with volatility and option premiums
- 2017Option book construction from implied volatility, historical volatility and premium
- 2018One-year volatility as the backdrop for short-horizon option trades
- 2019A low-volatility ETF sleeve inside a 2011 to 2019 market-regime case study