1989issue C031-7
Path quantiles versus net return for index velocity regimes
Studies that tracked the historical level of market volatility had not found substantial increases, and they did not examine travel speed. Editorial framing: pair historical volatility with market-regime classification and quantile analysis of path versus net return, so a single trade is judged against oscillation speed rather than average variance.
- Studies that tracked the historical level of market volatility had not found substantial increases, and those studies did not examine the speed of price movement.
- Stock-and-cash and futures portfolio-insurance implementations can raise velocity by generating large buy volume in advances and large sell volume in declines, because the flows are rule-driven rather than value-driven.
- Yearly interval-return percentiles from the median through the far tail showed no clear trend, while path rose over the sample and later accelerated, especially in the fastest intervals.
- Editorial reading: if prices cover more ground without larger net returns, judge a single trade against oscillation speed rather than average variance.
The archive compared the historical level of market volatility with short-window speed measures. Studies that tracked that level had not found substantial increases, and those studies did not examine the speed of price movement.
Editorial framing: evaluate a weeks-to-months market regime by pairing historical volatility with market-regime classification and quantile analysis. Ask whether prices are covering more ground without larger net returns.
Past variation is a regime input
Historical volatility is past variation in prices used to describe how unsettled a market has been. Here it is treated as a regime input rather than a forecast of future risk. Velocity is how quickly prices travel over a short sampling window, distinct from the level of volatility measured around a mean.
Rule-driven hedges can raise velocity
Reported assets managed with portfolio-insurance strategies had grown. Portfolio insurance is a mechanical floor-seeking overlay that reduces equity exposure as prices fall and restores it as prices rise, replicating option-like protection. It was implemented as stock-and-cash replication, a futures overlay, or purchased index puts. The futures overlay was the most widely used, despite rollover and mark-to-market cash-flow frictions.
The stock-cash and futures implementations assume continuous trading. The continuous-trading assumption is the premise that a hedge can be adjusted without gaps, delays, or a decision to wait for a later session. On several rapid declines some insurers deferred execution until the next session to avoid publicity and mispricing-related costs.
Those two implementations can raise market velocity by generating large buy volume in advances and large sell volume in declines, because the flows are rule-driven rather than value-driven. Informationless flow is rule-driven buying or selling that does not rest on a view of fair value, except for relative cash-versus-futures mispricing.
Program trades and the cash-futures basis
Cash-futures basis arbitrage was the dominant program-trade design. Program trading is simultaneous basket execution, often through an automated routing system, used for index-futures basis trades and other packaged flows. Basis is the gap between an index futures price and the cash index after ordinary carry adjustments, which can trigger two-market arbitrage. Related research placed futures price discovery ahead of cash.
Quantile analysis of path and interval return
The velocity sample used liquid S&P 500 names from the most actively traded NYSE quintile. It used overlapping half-hour intervals across a multi-year sample plus later months, and two speed measures: absolute interval return and path. Path is the distance traveled by prices inside an interval, built from successive absolute moves, which can stay large even when net displacement is small.
Quantile analysis compares ordered outcomes at selected percentiles instead of averages, so extreme intervals can be inspected separately from typical ones. Yearly half-hour return percentiles from the median through the far tail showed no clear trend, while path rose over the sample and accelerated in the later months, especially in the fastest intervals.
Oscillation rather than a faster trend
The path pattern is consistent with faster oscillation around equilibrium during extreme half-hour windows rather than a faster one-way trend, a result that average-based volatility studies would miss. Market-regime classification is a judgment about whether prices are trending, oscillating, or overshooting equilibrium over a weeks-to-months horizon, using cross-market prices, volatility, carry, and portfolio weights.
The results were treated as insufficient grounds to ban portfolio insurance or program trading. Data needed for a fuller review of one later crash session were not available.
S&P 500 path percentiles, 30-minute intervals, 1980–1987
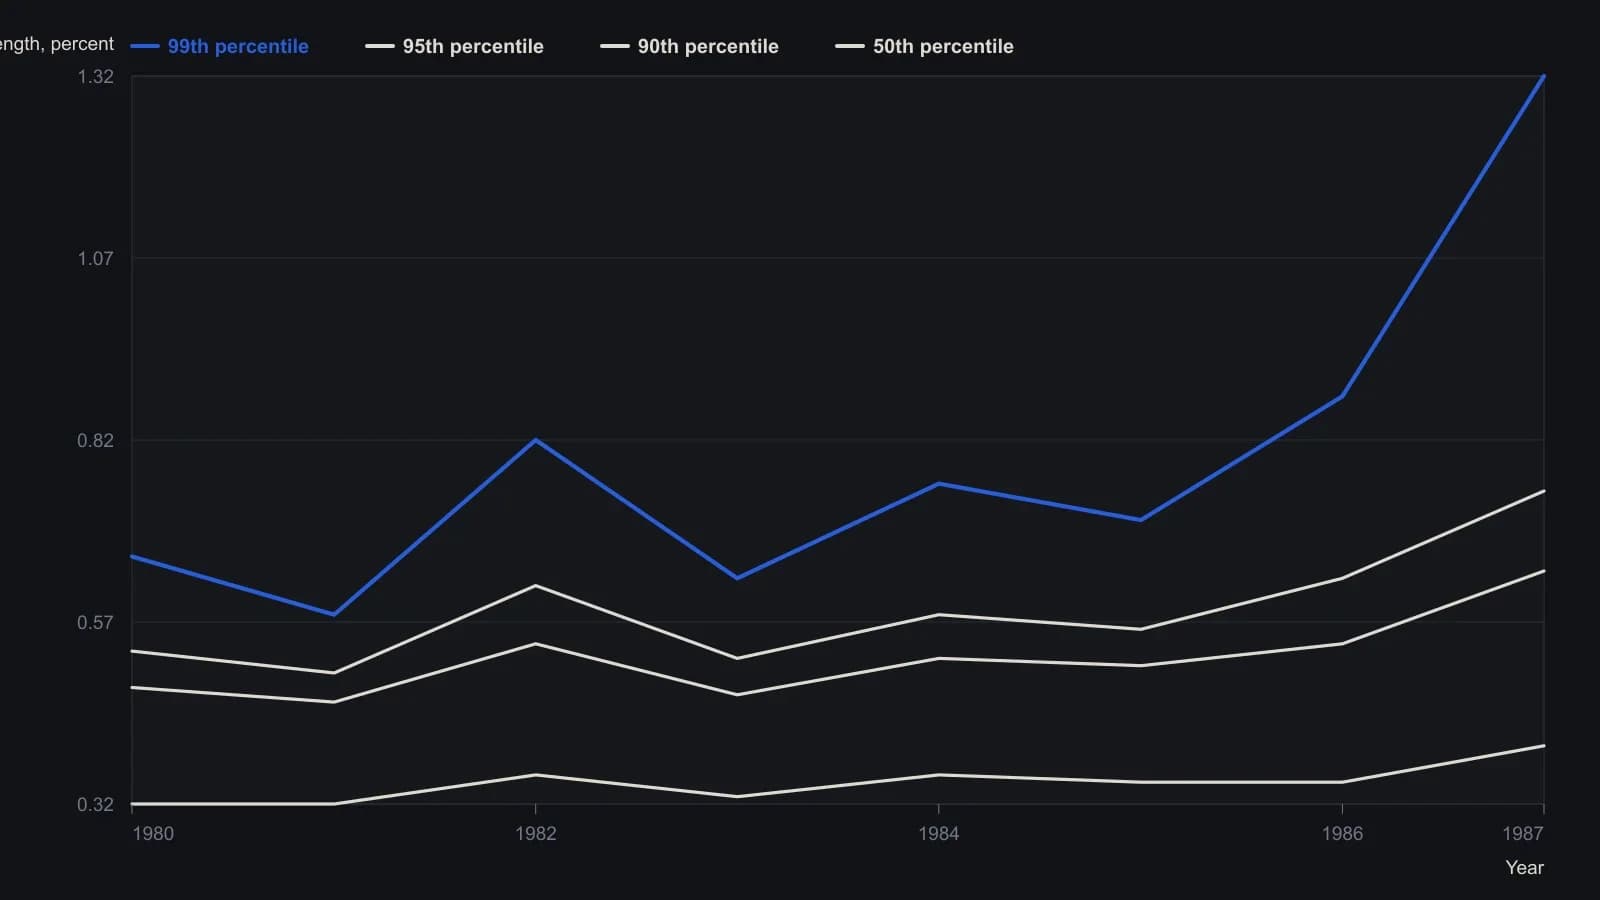
Yearly 50th/90th/95th/99th percentiles of path on overlapping 30-minute NYSE intervals that do not cross a day boundary; sample is the most-traded quintile of S&P 500 names, 1980–1986 plus Jan/Mar/Jun/Sep 1987. Digitized from the plotted curves; about 0.02 of a percentage point is the finest reading the raster supports.
All readings on this track · 6 readings
- 1986Evaluate the price random-walk question as a gated quantile lab
- 1989Path quantiles versus net return for index velocity regimes
- 1992Opening-referenced percentile stops for same-session gaps
- 1995Read one equity position on a joint yield-regime card
- 2012Construct a pairs-trading worksheet from residuals and quantile ranks
- 2015Constructing mean, median, and mode from ordered prices