2015issue C0228-33
Rebuild a volatility-skew template from size and slope
A volatility-skew template is a delta-based table rebuilt from historical strangle size and slope, then checked against live option premiums. When a later expiration no longer fits, that mismatch can be read as a change in market conditions.
- Group option chains by days to expiration and convert implied volatilities into a delta-based table normalized to the 50-delta implied volatility.
- Strangle size measures how far a matched out-of-the-money call and put sit from 50-delta implied volatility. Direction comes from subtracting the higher-delta node from the lower-delta node.
- Mean strangle size and mean strangle difference, plus or minus two standard deviations, produce a small family of theoretical skews expected to cover about 95 percent of unseen chains in that maturity class.
- The best live match minimizes the standard deviation of node-by-node implied-volatility differences. A later failed match can be read as a change in market conditions, not a reason to abandon unused calibrated skews.
Build a delta table by maturity class
Implied volatility analysis can turn grouped option chains into a volatility-skew template. Chains are first collected into classes of days to expiration. Implied volatilities are then converted into a delta-based table of values normalized to the 50-delta implied volatility. That table is the working curve for the maturity class.
Read size and slope from the same strangle
Historical volatility analysis summarizes that table through matched strangles. Strangle implied-volatility size measures how far the average of a matched out-of-the-money call and put sits from the 50-delta implied volatility. Size does not by itself indicate the direction of that segment of the skew.
Skew direction can be recovered from the same strangle by subtracting the higher-delta implied-volatility node from the lower-delta node. A negative difference means implied volatilities are higher toward in-the-money calls and out-of-the-money puts.
Form a small family of theoretical skews
Combining mean strangle size and mean strangle difference with plus or minus two standard deviations produces a small family of theoretical skews. That family is expected to cover about 95 percent of unseen chains in the same maturity class.
Match a live chain and check premiums
Among those candidate skews, the best match to a live chain is the template that minimizes the standard deviation of node-by-node implied-volatility differences.
Option premium analysis then tests whether that match is consistent. A template can be judged consistent when, strike by strike, the absolute gap between average model premiums and average market premiums stays at or below 20 percent of average vega, except at extreme far-from-the-money strikes.
60-day Bund skew: template IV versus settlement
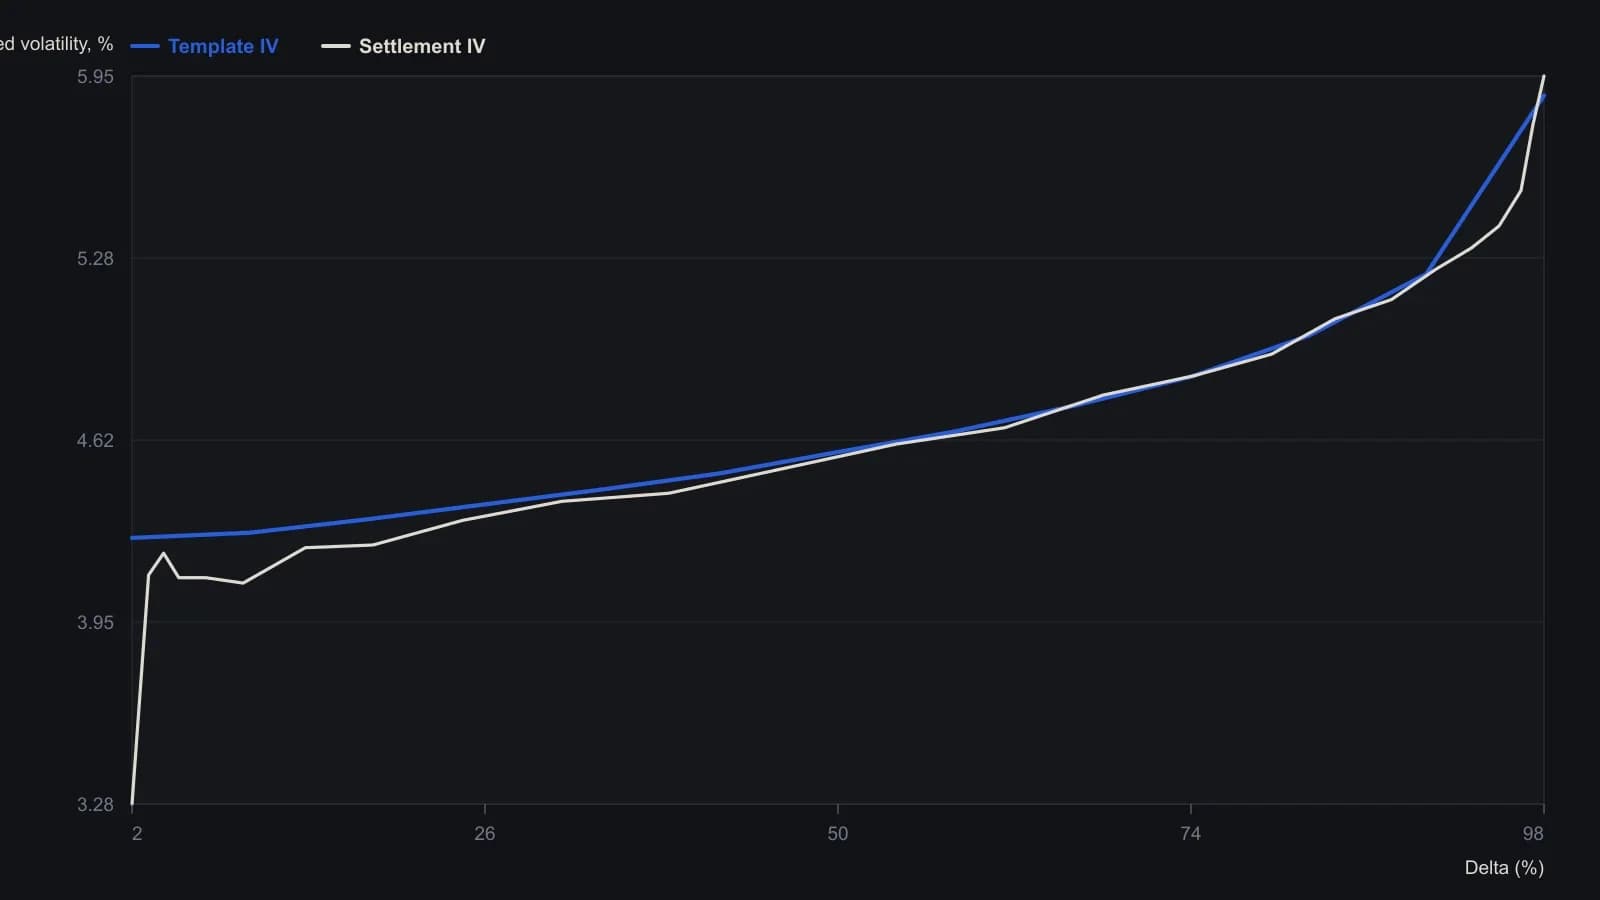
The 4.571% 50-delta IV is interpolated between the 52.52% and 44.76% settlement nodes; template IVs equal that ATM volatility times each tabulated ratio. Model strikes were inverted from delta. The most recent year was held out of the historical sample used to build the template.
Read a failed later match as a change in conditions
The same historically calibrated template can fail to match a later expiration. That failure can be read as a change in market conditions rather than as a reason to abandon the remaining unused skews from the last calibration.
All readings on this track · 31 readings
- 1985Putting listed option premiums in volatility-regime context
- 1988When volatility, not direction, selects the option spread
- 1988Path-aware volatility for option-replication cost
- 1989Option premium inside a volatility regime
- 1990Constructing consistent historical and implied volatility
- 1991Weekly close-to-close volatility as a horizon filter
- 1995A modified volatility construction for weeks-to-months regimes
- 1996Option smiles as a critique of constant volatility
- 1996Pairing short and long historical volatility for regime context
- 1998Normalized multi-horizon historical volatility construction
- 2001Park one options idea inside an implied and historical volatility regime
- 2002Constructing vertical spreads inside seasonal volatility regimes
- 2002Volatility regime context for option straddles
- 2003Option spread construction with volatility regime checks
- 2003Trend and volatility filters for option spread choice
- 2005Constructing vertical spreads inside volatility regimes
- 2006Implied volatility doubling as a commodity regime signal
- 2007A butterfly reversal call when implied volatility sits near historical volatility
- 2012Evaluate a broken-wing butterfly inside a volatility and premium regime
- 2012Regime-aware equity construction via carry and risk premium
- 2012True range overlays versus isolated bar context
- 2012Constructing regime context for option premium trades
- 2013Construct a ranked volatility switch before the trend filter fires
- 2013Combining Relative Strength Index, historical volatility, and Bollinger %b screens
- 2014A headline equity high is incomplete until the nominal-real spread is read
- 2015Daily implied volatility skew as a portfolio benchmark
- 2015Rebuild a volatility-skew template from size and slope
- 2015Evaluating concentrated winners with volatility and option premiums
- 2017Option book construction from implied volatility, historical volatility and premium
- 2018One-year volatility as the backdrop for short-horizon option trades
- 2019A low-volatility ETF sleeve inside a 2011 to 2019 market-regime case study