2013issue C0266-72
Construct a ranked volatility switch before the trend filter fires
Treat the regime switch as a construction problem. Specify dailyChange, the historicalVolatility window, and regimeThreshold so volatilitySwitch can gate which trend filter is allowed to fire.
- dailyChange is the one-bar close-to-close difference scaled by the average of the current and prior close, and historicalVolatility is the standard deviation of that series over a chosen lookback.
- volatilitySwitch counts how many lookback readings sit at or below the latest historicalVolatility and, in several reconstructions, divides a 21-bar count by 21 so the output lies on a 0-to-1 scale.
- regimeThreshold, commonly 0.5, labels trendMode at or below the midpoint and meanReversionMode above it, then the switch selects trend-following or countertrend rules.
- Lookback length, moving-average length, the maximum switch level treated as trending, and an oscillator exit level are separate, tunable construction parameters.
Start with the construction, not the trade
Editorial framing: a volatility regime switch is treated here as a specification problem. Name the return, the historical-volatility window, and the midpoint cut first, so the finished output can gate which trend filter is allowed to fire.
The archive describes that workflow. It does not present a single switch reading as a complete decision.
Define dailyChange and historicalVolatility
Daily change in the construction is the current close minus the prior close, divided by the average of those two closes. That quantity is dailyChange: a one-bar close-to-close difference scaled by the average of the current and prior close.
historicalVolatility is the standard deviation of dailyChange over a chosen lookback.
Turn the latest reading into volatilitySwitch
The switch is built by taking historicalVolatility of that one-bar close-to-close change and scoring how many lookback readings sit at or below the latest reading. That share is volatilitySwitch.
Several reconstructions use a 21-bar lookback for both the volatility window and the rank count, then divide that count by 21 so the output lies on a 0-to-1 scale.
Cut the scale at regimeThreshold
A reading above 0.5 is treated as a mean-reversion or consolidation regime, while a reading at or below 0.5 is treated as a trending regime. That midpoint cut is regimeThreshold.
trendMode is the classification used when the switch sits at or below the midpoint and is paired with trend-following rules. meanReversionMode is the classification used when the switch sits above the midpoint and is paired with countertrend rules.
S&P 500 21-day volatility switch versus the 0.5 regime cut
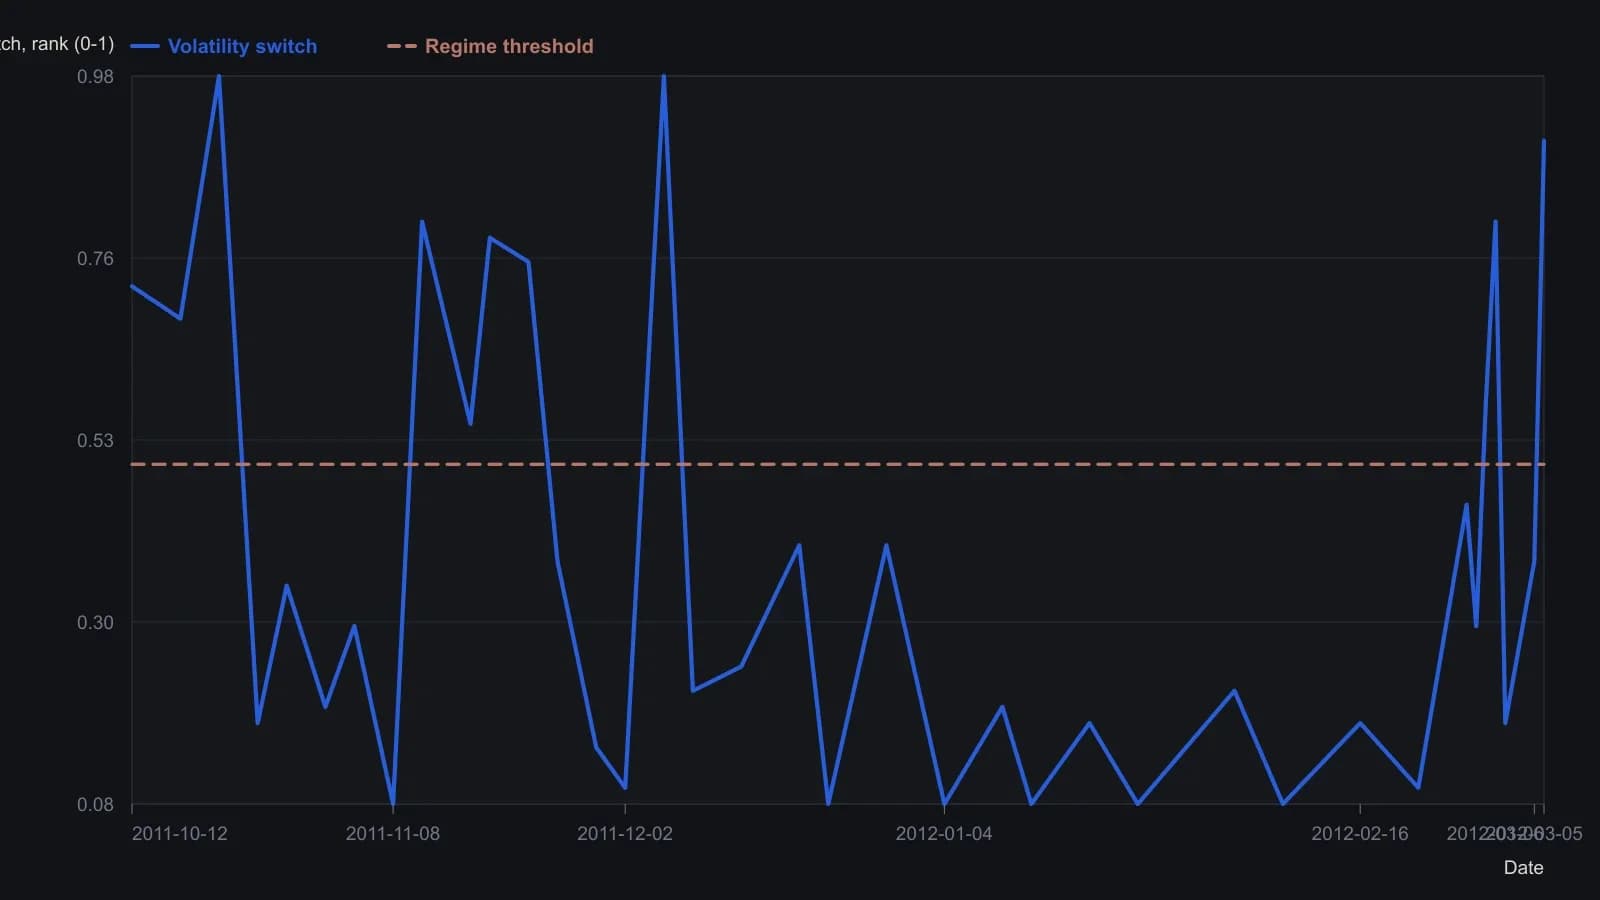
The plotted study is the 21-day volatility switch. Source implementations treat readings above 0.5 as mean-reversion and readings at or below 0.5 as trend. Digitized y-values are approximate to two decimals; 0.90 is the printed pane label.
Use the switch to gate the rule class
The switch is applied as a filter that selects trend-following rules in the trending class and countertrend or oscillator rules in the mean-reverting class.
One illustrative pairing uses a 10-bar and 20-bar simple moving-average cross for trend-mode entries, a two-bar relative-strength oscillator for countertrend entries, and a five-bar price-channel exit.
Encode the two classes on a chart
Chart encodings mark readings above 0.5 in one color and readings at or below 0.5 in another so a sequence of bars can be inspected for an approaching regime change.
Keep the construction parameters separate
Lookback length, moving-average length, the maximum switch level treated as trending, and an oscillator exit level are listed as separate, tunable construction parameters.
All readings on this track · 31 readings
- 1985Putting listed option premiums in volatility-regime context
- 1988When volatility, not direction, selects the option spread
- 1988Path-aware volatility for option-replication cost
- 1989Option premium inside a volatility regime
- 1990Constructing consistent historical and implied volatility
- 1991Weekly close-to-close volatility as a horizon filter
- 1995A modified volatility construction for weeks-to-months regimes
- 1996Option smiles as a critique of constant volatility
- 1996Pairing short and long historical volatility for regime context
- 1998Normalized multi-horizon historical volatility construction
- 2001Park one options idea inside an implied and historical volatility regime
- 2002Constructing vertical spreads inside seasonal volatility regimes
- 2002Volatility regime context for option straddles
- 2003Option spread construction with volatility regime checks
- 2003Trend and volatility filters for option spread choice
- 2005Constructing vertical spreads inside volatility regimes
- 2006Implied volatility doubling as a commodity regime signal
- 2007A butterfly reversal call when implied volatility sits near historical volatility
- 2012Evaluate a broken-wing butterfly inside a volatility and premium regime
- 2012Regime-aware equity construction via carry and risk premium
- 2012True range overlays versus isolated bar context
- 2012Constructing regime context for option premium trades
- 2013Construct a ranked volatility switch before the trend filter fires
- 2013Combining Relative Strength Index, historical volatility, and Bollinger %b screens
- 2014A headline equity high is incomplete until the nominal-real spread is read
- 2015Daily implied volatility skew as a portfolio benchmark
- 2015Rebuild a volatility-skew template from size and slope
- 2015Evaluating concentrated winners with volatility and option premiums
- 2017Option book construction from implied volatility, historical volatility and premium
- 2018One-year volatility as the backdrop for short-horizon option trades
- 2019A low-volatility ETF sleeve inside a 2011 to 2019 market-regime case study