2012issue C0310-13
Regime-aware equity construction via carry and risk premium
Constructed equity price is treated as responding to earnings per share, earnings growth, the risk-free interest rate, and the equity risk premium. Those channels can then be read through implied volatility, historical volatility, and option premium to place one name in a weeks-to-months market regime.
- Constructed price is specified as rising with earnings per share and earnings growth, and falling with the risk-free interest rate and the equity risk premium.
- The risk-free interest rate has a direct price link and a second path through earnings per share. Reported rate and premium effects are direct impacts only and therefore a lower bound.
- Implied volatility, historical volatility, and option premium are used to test whether a carry or risk-premium shift is already in the surface, the recent path, or the option cost charged for the regime.
- Inflation is left out of the driver set because it does not change a cross-section of stocks and is treated as common to all names over equal time spans.
Four drivers of constructed price
Constructed equity price is treated as responding to four drivers: earnings per share, earnings growth, the risk-free interest rate, and the equity risk premium.
Earnings per share is period earnings available to equity holders and is treated as a positive direct contributor to constructed price. Earnings growth is expected expansion of future earnings and is treated as a positive direct contributor to constructed price. The risk-free interest rate and the equity risk premium are specified as negatively related to price.
Carry, expected return, and a second rate path
The risk-free interest rate is the carry benchmark that discounts equity and competes with stocks as an alternative holding. It is mapped with a direct price link and a second link that runs through earnings per share.
Expected return is defined as the risk-free rate plus the equity risk premium. The equity risk premium is the extra expected return demanded for holding risky equity instead of a risk-free claim, and a strong-sentiment setting is associated with a small premium.
Cross-market carry is the rate and alternative-asset backdrop that reweights demand between bonds and equities.
Sizing each driver's price effect
A valuation identity that uses forecast earnings, an earnings growth rate, the risk-free rate, and the equity risk premium is used to size each driver's price effect.
In a two-name illustration, a 0.25-percentage-point rise in the risk-free rate corresponds to modeled price changes of -3.6% and -6.8%. In the same illustration, a 0.5-percentage-point fall in the equity risk premium corresponds to modeled price changes of 7.9% and 16.6%. A one-point rise in earnings growth corresponds to modeled price changes of 1.6% and 2.4%, while a 1% rise in earnings per share corresponds to a 1% price change in both names.
The rate and premium effects are reported as direct impacts only and therefore as a lower bound. Rate adjustments are described as occurring progressively and often before official implementation.
Why inflation is left out
Inflation is left out of the driver set because it does not change a cross-section of stocks and, over equal time spans, is treated as common to all names.
Price impact of four valuation drivers on Timken and Marriott
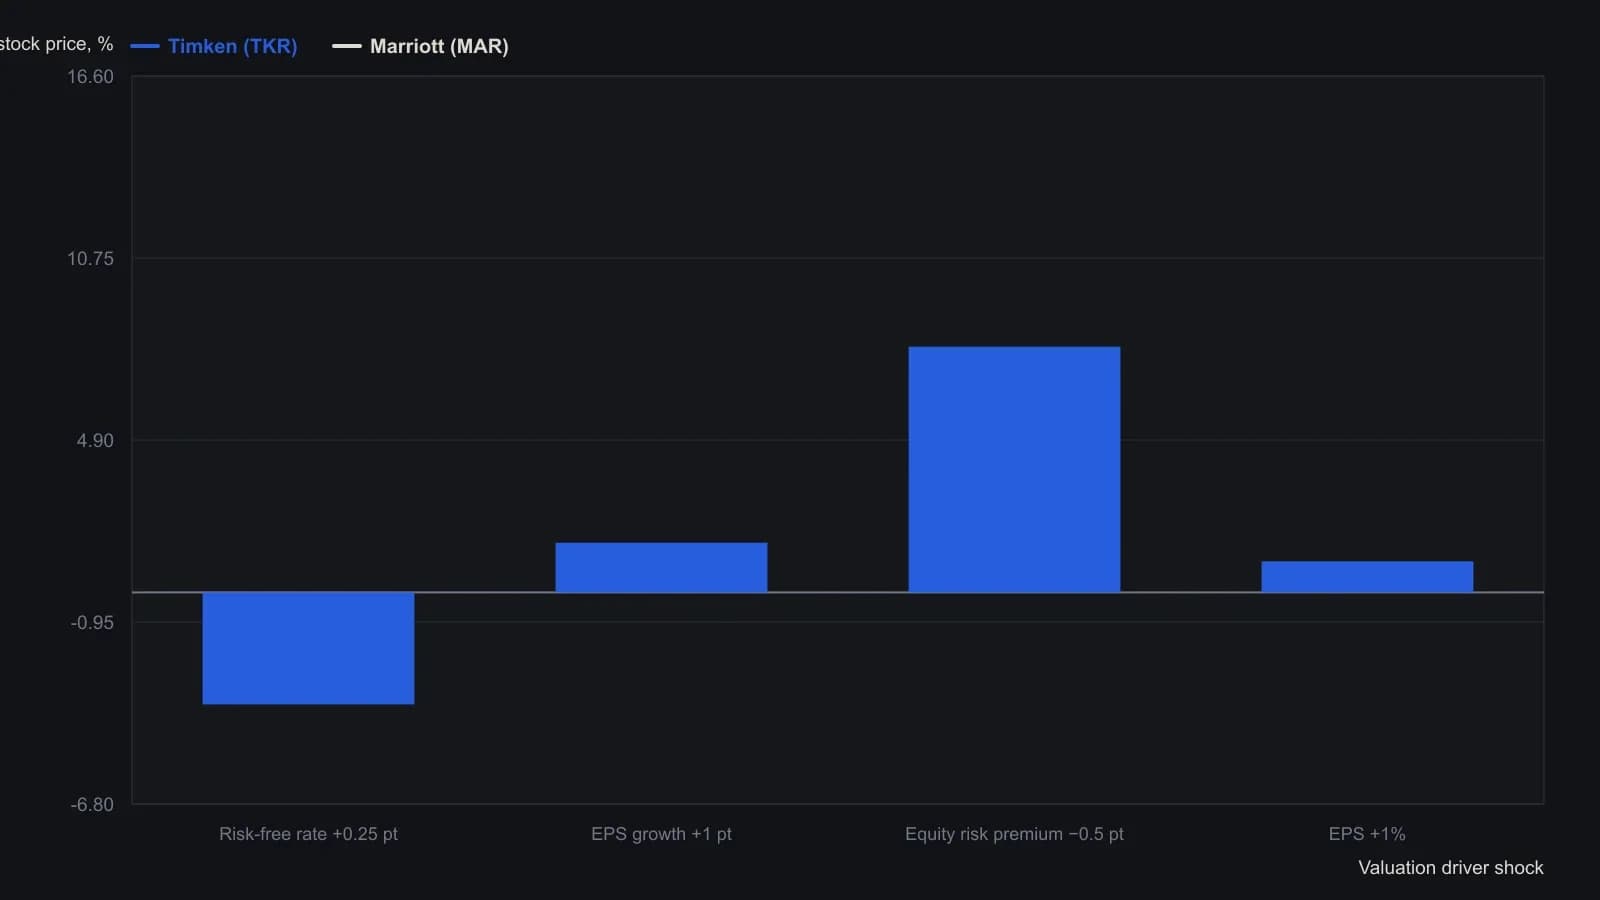
Effects are the direct price responses from the Luoma–Sahlström valuation model only; the authors say they could not size the indirect rate-through-EPS channel, so the figures are a lower bound.
All readings on this track · 31 readings
- 1985Putting listed option premiums in volatility-regime context
- 1988When volatility, not direction, selects the option spread
- 1988Path-aware volatility for option-replication cost
- 1989Option premium inside a volatility regime
- 1990Constructing consistent historical and implied volatility
- 1991Weekly close-to-close volatility as a horizon filter
- 1995A modified volatility construction for weeks-to-months regimes
- 1996Option smiles as a critique of constant volatility
- 1996Pairing short and long historical volatility for regime context
- 1998Normalized multi-horizon historical volatility construction
- 2001Park one options idea inside an implied and historical volatility regime
- 2002Constructing vertical spreads inside seasonal volatility regimes
- 2002Volatility regime context for option straddles
- 2003Option spread construction with volatility regime checks
- 2003Trend and volatility filters for option spread choice
- 2005Constructing vertical spreads inside volatility regimes
- 2006Implied volatility doubling as a commodity regime signal
- 2007A butterfly reversal call when implied volatility sits near historical volatility
- 2012Evaluate a broken-wing butterfly inside a volatility and premium regime
- 2012Regime-aware equity construction via carry and risk premium
- 2012True range overlays versus isolated bar context
- 2012Constructing regime context for option premium trades
- 2013Construct a ranked volatility switch before the trend filter fires
- 2013Combining Relative Strength Index, historical volatility, and Bollinger %b screens
- 2014A headline equity high is incomplete until the nominal-real spread is read
- 2015Daily implied volatility skew as a portfolio benchmark
- 2015Rebuild a volatility-skew template from size and slope
- 2015Evaluating concentrated winners with volatility and option premiums
- 2017Option book construction from implied volatility, historical volatility and premium
- 2018One-year volatility as the backdrop for short-horizon option trades
- 2019A low-volatility ETF sleeve inside a 2011 to 2019 market-regime case study