1996issue C081-3
Volatility-ratio, inside-day and narrow-range-4 entry construction
A historical volatility ratio below 0.5 is joined to an inside day or a narrow-range-4 bar to form one setup. Some constructions then place a buy stop above that bar and a sell stop below it, rather than entering on the close.
- A historical volatility ratio divides a short-window standard deviation of log one-day close ratios by the same statistic over a much longer window.
- The setup condition is true only when that ratio is below 0.5 and the same bar is either an inside day or a narrow-range-4 bar.
- Some constructions then place a buy stop above the setup high and a sell stop below the setup low instead of entering on the setup close.
- A scanner or alarm can be reduced to the conjunction of the sub-0.5 volatility condition and the range-pattern condition.
A single boolean procedure
The archive codes two screens on the same bar. A historical volatility ratio is formed by dividing a short-window standard deviation of log one-day close ratios by the same statistic over a much longer window. An inside day or a narrow-range-4 bar supplies the range-compression test.
TradersWeek editorial reading: join those tests as one setup condition. Entry, opposing-stop placement, and abstention can then be checked as a single construction rather than as stacked discretionary filters.
How the volatility ratio is coded
A historical volatility ratio is a short-window standard deviation of log one-day close-to-close changes divided by the same statistic over a much longer window.
A six-versus-one-hundred comparison is sometimes coded with five and ninety-nine observations because a 100-session span produces 99 one-day changes. The volatility function can annualize with either 365 calendar days or 250 trading days and can change the period length when bars are daily versus weekly.
Inside day and narrow-range-4
An inside day is a bar whose high is below the prior high and whose low is above the prior low. It is coded as a bar with a lower high and a higher low than the immediately preceding bar.
A narrow-range-4 bar is a session whose high-low range is smaller than each of the prior three session ranges.
The setup condition
The composite setup is true only when the volatility ratio is below 0.5 and the same bar is either an inside day or a narrow-range-4 bar.
A scanner or alarm can be reduced to the conjunction of the sub-0.5 volatility condition and the range-pattern condition.
Stop-breakout entry
After that setup, some constructions place a buy stop above the setup high and a sell stop below the setup low instead of entering on the setup close.
TradersWeek editorial reading: those pending stops are the entry rule. Until one side is reached the construction abstains, and the unfilled stop is the opposing-stop placement.
OEX names meeting the volatility-ratio setup on 11 June 1996
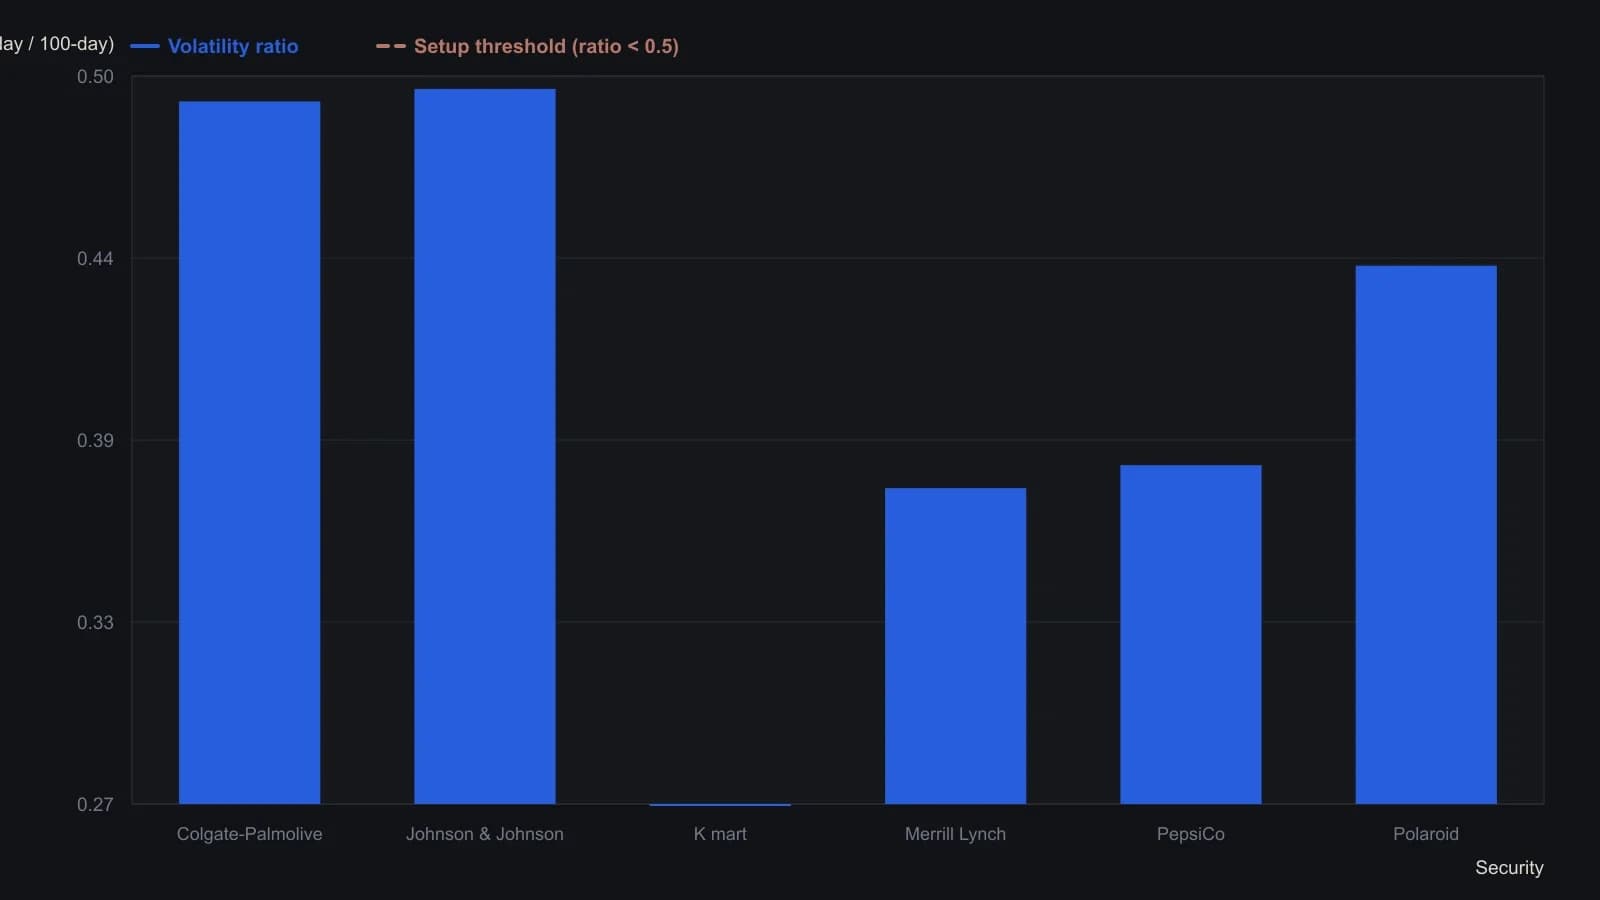
TechniFilter Plus notes that five- and 99-day standard deviations of log one-day price-change ratios reproduce the article’s six- and 100-day periods, because 100 daily closes yield 99 one-day changes. The MetaStock Explorer in the table uses five and 99 in the same way; TradeStation’s HisVol function uses six and 100 with a 365-day annualiser. WAVE WI$E reports 119 trades / 589 DJIA points on the log-ratio formula from 29 March 1988 to 23 February 1996, versus 532 trades / 973 points if only close-to-close standard deviation is used.
All readings on this track · 25 readings
- 1986Construct a decision procedure that revises itself
- 1989Finish the volume checklist before scoring the breakout
- 1989Constructing supervised forecasts on moving averages
- 1991Candlestick labels as stacked construction tests
- 1992Walk-forward evaluation of weekly price-change patterns
- 1993RSI price pattern templates and open interest
- 1994Constructing a dual-net day-ahead index direction forecast
- 1994A clocked stochastic second crest with a window-high stop
- 1996Volatility-ratio, inside-day and narrow-range-4 entry construction
- 1998Sliding-window correlation for cup-and-handle construction
- 2000Constructing rectangles for breakout hypotheses
- 2001Turning one candle into a ranked numeric object
- 2002Fuzzy-scored chart patterns as testable rules
- 2002From hot-zones to an open-close-matrix
- 2003Volume pressure and a band-clearing breakout case
- 2004Evaluating chart patterns against price objectives
- 2004Cobweb turning points from price structure
- 2005Hybrid decision trees and pattern recognition for trend rules
- 2005Two-bar zone codes for testable pattern systems
- 2005Price bar pattern construction and next-bar frequency
- 2008Observe markets before following pattern or system rules
- 2012Treat a four-leg Fibonacci completion as an unpaid hypothesis
- 2014Hidden three-channel regression signals for stock and call option entries
- 2014A shared daily-chart-level framework for session trades and swing holds
- 2015Condensed candlestick signatures