2005issue C071-5
Two-bar zone codes for testable pattern systems
Each open, high, low, and close of a two-bar candlestick is mapped to a zone and joined into a four-digit code. That code can be scanned, counted, and used as one mechanical entry-or-abstain input.
- Map each open, high, low, and close to one of six numbered zones, then concatenate those numbers into one four-digit code.
- Identical two-bar structures share that code across charts and time frames, so a scan can mark and count the same Candlestick patterns condition.
- The primary forecast after a recognized code is whether the next bar closes above or below its own open.
- Prior-bar zone location is a Mechanical trading system input for breakout entries, support-and-resistance positioning, and long or short abstention.
Map open, high, low, and close to zones
Each open, high, low, and close is mapped to one of six numbered zones relative to the prior bar's high, low, midpoint, and a 10-bar average true range band. Zone 0 is assigned when a bar component sits more than one 10-bar average true range below the prior low. Zone 5 is assigned when it sits at least one 10-bar average true range above the prior high.
Join the zones into one four-digit code
The four zone numbers are concatenated into a single four-digit code so identical two-bar structures share one unambiguous identifier across charts and time frames. Inside-bar examples are coded 3434, 3424, and 3322. Outside-bar examples are coded 2414, 2514, and 3502.
Count the next-bar close
The primary forecast counted after a recognized code is whether the next bar closes above or below its own open. A chart study marks matching bars and exposes the code, prior-bar zone description, and next-bar close counts only on those marked bars. The same scan can be applied at the end of each session across a portfolio to collect recurring two-bar codes and compare their next-bar outcomes by market and time frame.
Use prior-bar location in one procedure
Prior-bar zone location is intended as a rule input for breakout entries, support-and-resistance positioning, and long or short abstention once a chosen code appears.
Next-bar close after two-bar code 3434 on S&P 500 daily
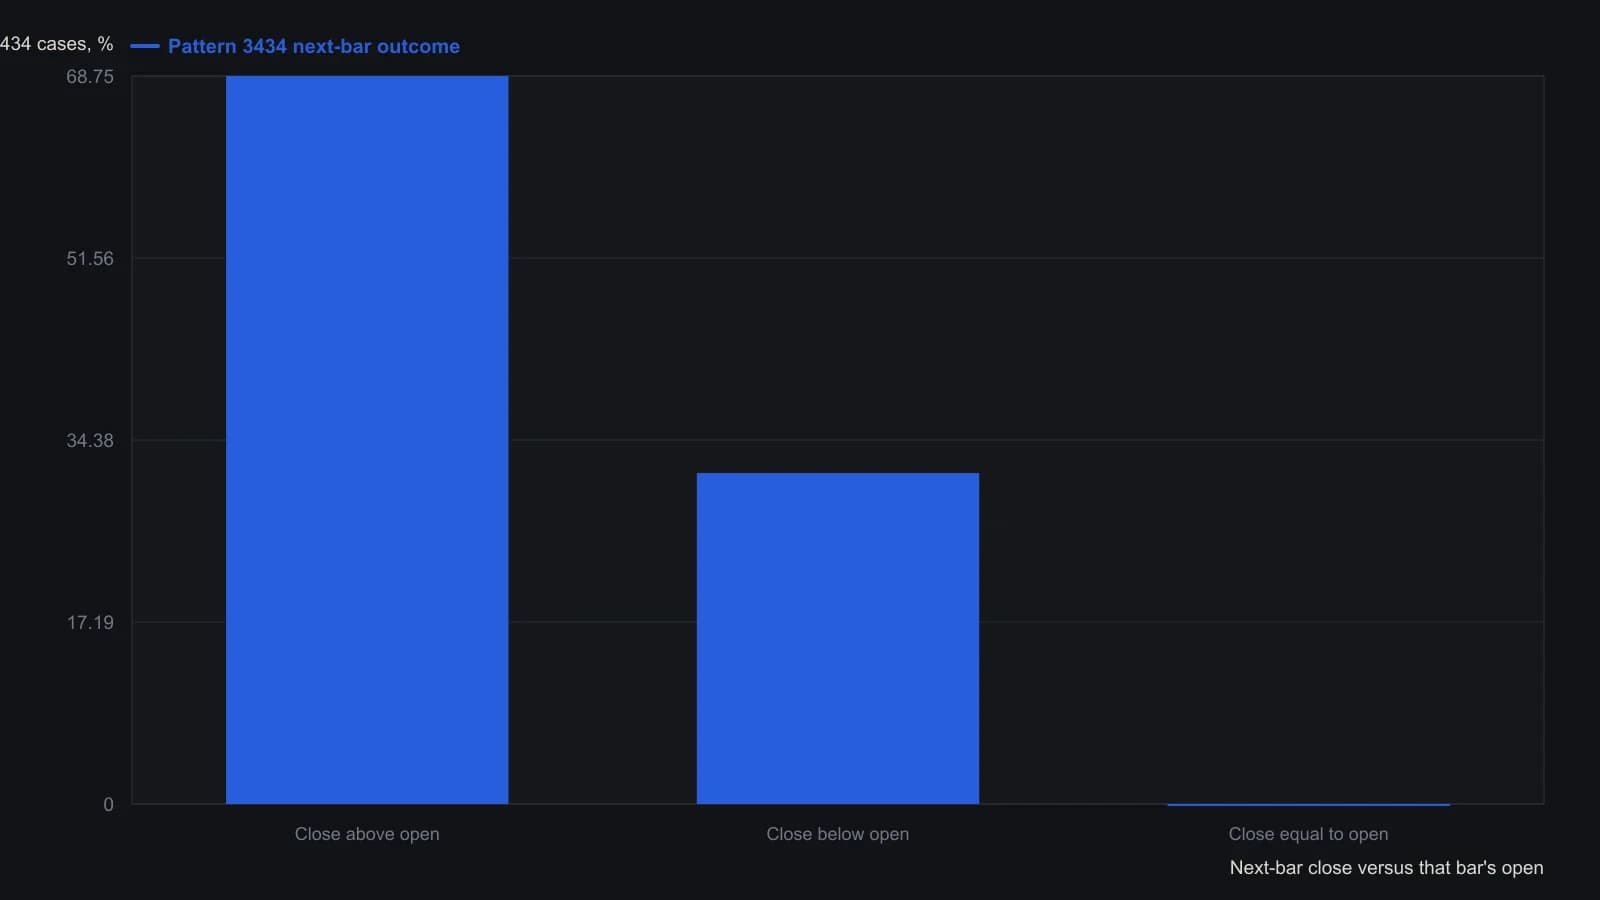
The 16-case tally excludes the bar under the cursor and equals 8.42 percent of the bars loaded on that chart. Zone membership uses a 10-bar ATR. The ShowMe default code is 3434; the author suggested a Diff of 5 for the S&P 500.
All readings on this track · 25 readings
- 1986Construct a decision procedure that revises itself
- 1989Finish the volume checklist before scoring the breakout
- 1989Constructing supervised forecasts on moving averages
- 1991Candlestick labels as stacked construction tests
- 1992Walk-forward evaluation of weekly price-change patterns
- 1993RSI price pattern templates and open interest
- 1994Constructing a dual-net day-ahead index direction forecast
- 1994A clocked stochastic second crest with a window-high stop
- 1996Volatility-ratio, inside-day and narrow-range-4 entry construction
- 1998Sliding-window correlation for cup-and-handle construction
- 2000Constructing rectangles for breakout hypotheses
- 2001Turning one candle into a ranked numeric object
- 2002Fuzzy-scored chart patterns as testable rules
- 2002From hot-zones to an open-close-matrix
- 2003Volume pressure and a band-clearing breakout case
- 2004Evaluating chart patterns against price objectives
- 2004Cobweb turning points from price structure
- 2005Hybrid decision trees and pattern recognition for trend rules
- 2005Two-bar zone codes for testable pattern systems
- 2005Price bar pattern construction and next-bar frequency
- 2008Observe markets before following pattern or system rules
- 2012Treat a four-leg Fibonacci completion as an unpaid hypothesis
- 2014Hidden three-channel regression signals for stock and call option entries
- 2014A shared daily-chart-level framework for session trades and swing holds
- 2015Condensed candlestick signatures