1994issue C101-5
Constructing a dual-net day-ahead index direction forecast
A day-ahead index forecast can be built as a construction problem. Ordered prices are detrended over a fixed lookback, two related pattern recognizers are trained on different series features, a signal exists only when they agree, and a later unused window is kept so the built baseline can be compared with a true holdout.
- A pattern-recognition forecast maps a fixed lookback of ordered observations to a forecast label by adjusting connection strengths until the response is acceptably close to a chosen target, then applying that map to unseen inputs.
- Raw index levels are a poor representation, so each close or high is detrended against a 10-day moving average and presented as a rolling 10-day window of relative deviations.
- One net is trained on detrended closes and another on detrended highs. Dual-net confirmation issues a signal only when both maps agree on next-session direction, encoded as a long-the-open or short-the-open label rather than a point price.
- Training uses two years of history and reserves the following five months as a forward window. A map trained only on the associations it has been shown cannot be assumed to handle later events absent from that history.
A forecast built from ordered stimuli
A pattern-recognition forecast is a quantitative model that maps a fixed lookback of ordered market observations to a forecast label rather than a discretionary rule. The map is built by presenting those ordered observations as stimuli, adjusting internal connection strengths until the mapped response is acceptably close to a chosen target, and then applying that trained map to unseen inputs.
Editorial: treat the day-ahead index forecast as a construction problem. Specify the detrend, train two related pattern recognizers on different series features, require agreement before a signal exists, and keep a later unused window so the built baseline can be compared with a true holdout.
Detrending before the map sees the series
Raw index levels are a poor representation for this construction. The series is first rewritten as a normalized change so the model compares relative moves rather than exact prices.
Detrending subtracts a moving average from the raw series so the model sees relative deviations instead of absolute price levels. The working preprocess subtracts a 10-day moving average from each close or high and feeds a rolling 10-day window of those detrended daily values.
Two features, one confirmation rule
Two models share that window but not the same feature. One is trained on detrended daily closes and the other on detrended daily highs. Dual-net confirmation issues a signal only when both independently trained models agree on the next interval’s direction.
The target is next-session direction, encoded as a long-the-open/flat-the-close label versus a short-the-open/flat-the-close label, not a point estimate of tomorrow’s price. The stimulus-response map is the learned association between that preprocessed input window and the desired output label.
How the two nets are trained
Training uses two years of historical observations. Each net makes a single pass over that training history. The close model uses an 85 percent learning rate and the high model uses a 60 percent learning rate. Learning rate is a training control that limits how completely a new association is written on first exposure so the model does not merely memorize noise.
Both nets use a 100 percent memory profile so older associations are not aged out. Memory profile is a retention setting that decides whether older encoded associations keep equal influence on later responses.
Both nets are specified with 300 synaptic statistics, a conjugate option intended for negatively sloped functions, no sigmoid postprocessing on the output, unit-coefficient linear conversion on the response, and unit-coefficient sigmoid conversion on unbounded stimulus data. Complex-valued encoding is used so many stimulus-response patterns occupy the same stored footprint as a single pattern.
A forward window after training
The following five months are reserved as a forward window to inspect whether the mapping generalizes. A forward window is a later sampling interval held out after training and used only to inspect generalization.
A model trained only on the associations it has been shown cannot be assumed to respond correctly if later market conditions introduce events absent from that input history.
S&P 400 close versus simulated dual-net equity
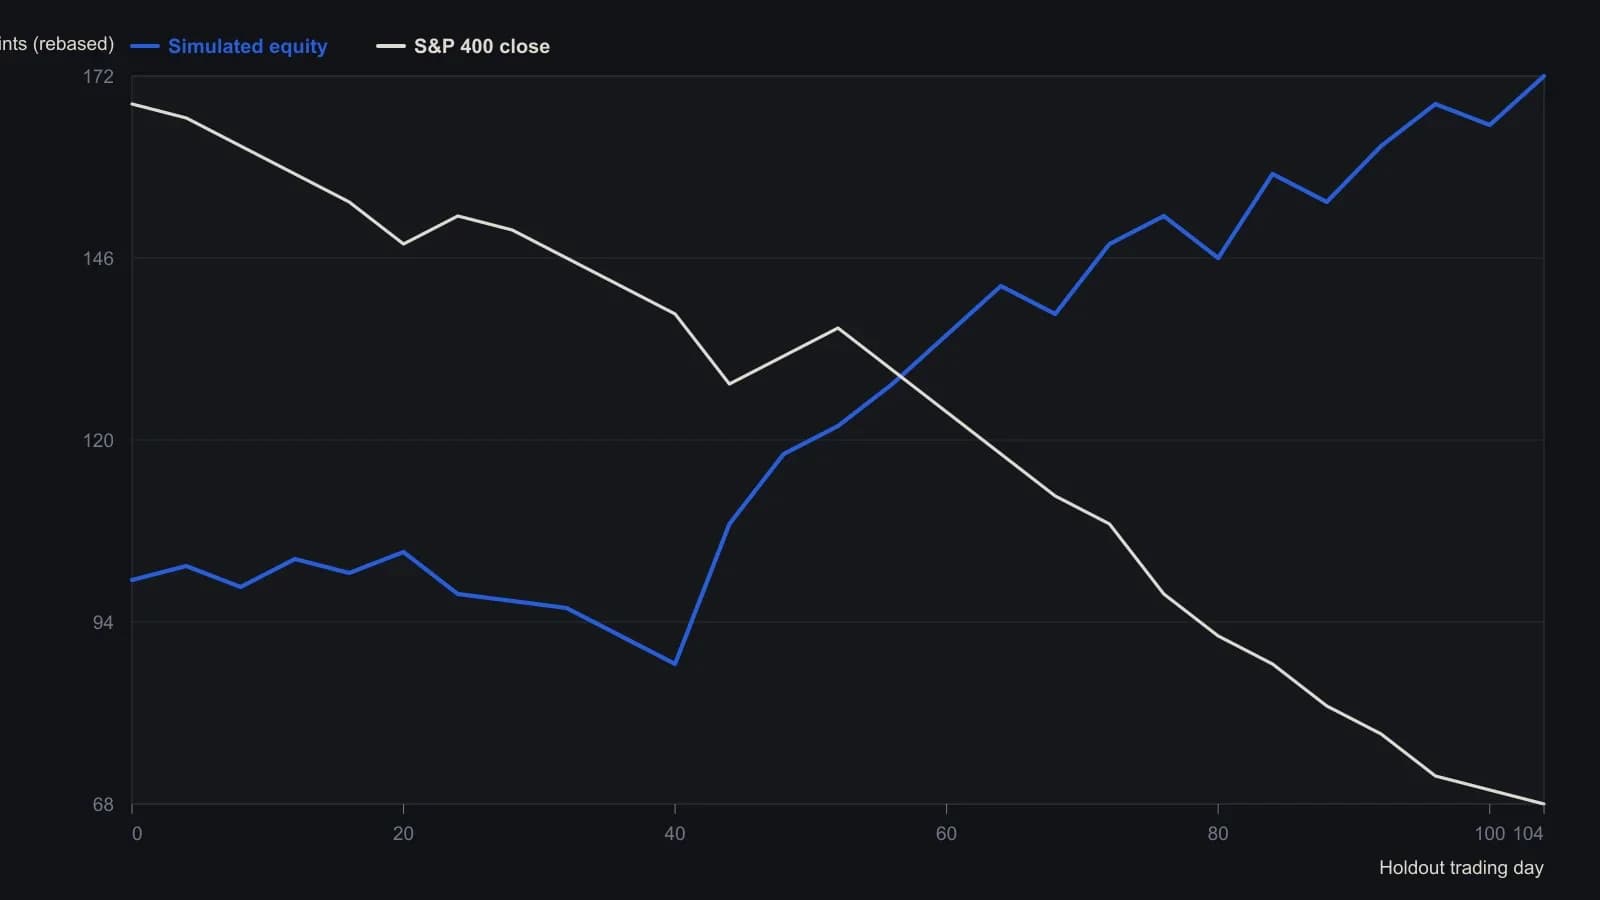
Both nets used a rolling 10-day window detrended by a 10-day moving average. A trade exists only when the close-based net and the high-based net agree. Training covered two years of cash data; this plot is the unused five-month holdout. Orders were placed in the futures, not the cash index.
All readings on this track · 25 readings
- 1986Construct a decision procedure that revises itself
- 1989Finish the volume checklist before scoring the breakout
- 1989Constructing supervised forecasts on moving averages
- 1991Candlestick labels as stacked construction tests
- 1992Walk-forward evaluation of weekly price-change patterns
- 1993RSI price pattern templates and open interest
- 1994Constructing a dual-net day-ahead index direction forecast
- 1994A clocked stochastic second crest with a window-high stop
- 1996Volatility-ratio, inside-day and narrow-range-4 entry construction
- 1998Sliding-window correlation for cup-and-handle construction
- 2000Constructing rectangles for breakout hypotheses
- 2001Turning one candle into a ranked numeric object
- 2002Fuzzy-scored chart patterns as testable rules
- 2002From hot-zones to an open-close-matrix
- 2003Volume pressure and a band-clearing breakout case
- 2004Evaluating chart patterns against price objectives
- 2004Cobweb turning points from price structure
- 2005Hybrid decision trees and pattern recognition for trend rules
- 2005Two-bar zone codes for testable pattern systems
- 2005Price bar pattern construction and next-bar frequency
- 2008Observe markets before following pattern or system rules
- 2012Treat a four-leg Fibonacci completion as an unpaid hypothesis
- 2014Hidden three-channel regression signals for stock and call option entries
- 2014A shared daily-chart-level framework for session trades and swing holds
- 2015Condensed candlestick signatures