2005issue C071-17
Price bar pattern construction and next-bar frequency
Each price bar can be labeled with a discrete four-point location code. After that identity is built, the same chart can count how often the code appears and how often the next bar closes higher.
- Open, high, low, and close are each mapped into six zones around the prior bar, then packed into one numeric pattern identity.
- A screening display can show the latest end-of-bar pattern, its event count in the last 500 bars, and how many of those events were followed by a higher next-bar close.
- A minimum-sample floor, defaulting to 9, keeps sparse codes below a reporting threshold.
- The same zone construction can isolate a chosen four-tuple and summarize the average percentage change a stated number of days later.
Treat each bar as a constructed code
Each price bar can be labeled with a discrete pattern code, after which both the code’s occurrence count and the count of following bars that closed higher can be tallied on a chart. Pattern-recognition here means assigning each bar a discrete open-high-low-close location code relative to the prior bar, counting how often that code appears in a defined lookback, and recording how often the following bar closes higher.
Construction builds that identity from ordered price observations by mapping each of open, high, low, and close into numbered zones around the previous bar’s low, midpoint, high, and a volatility envelope.
Map open, high, low, and close into six zones
A zone is one of six ranked price bands defined from the prior bar: below the prior low minus a 10-period average true range, between that floor and the prior low, between the prior low and the midpoint, between the midpoint and the prior high, between the prior high and the prior high plus a 10-period average true range, or above that ceiling. Open, high, low, and close are each mapped into those six zones.
Those four zone scores can be packed into one numeric pattern identity by weighting open by 1000, high by 100, low by 10, and close by 1. Once a packed pattern identity is defined, its historical share of all bars can be reported as a percentage of the time that identity has occurred.
Screen the latest code, the event count, and next-bar up closes
A screening display can show three constructed fields for each security: the latest end-of-bar pattern, how many times that pattern appeared in the last N bars, and how many of those times the next bar closed higher than the pattern bar. The default lookback used when counting pattern occurrences in that screening display is 500 bars. Event count is the number of times the current end-of-bar pattern code has already occurred inside a stated lookback window.
The supplied indicator treats a bar as an up day when its close is greater than its open and otherwise records a zero, then adds that binary outcome to the matching pattern’s historical up-count. A next-bar up close is that binary outcome on the bar after the pattern bar: one when the close is greater than the open, otherwise zero.
A minimum sample is a user-set floor on how many historical matches are required before a pattern’s frequency statistics are treated as reportable. A minimum-sample input with a default of 9 is part of the same pattern-and-statistics construction, so sparse codes can be held below a reporting threshold.
Nasdaq 100 pattern hits and next-bar up closes
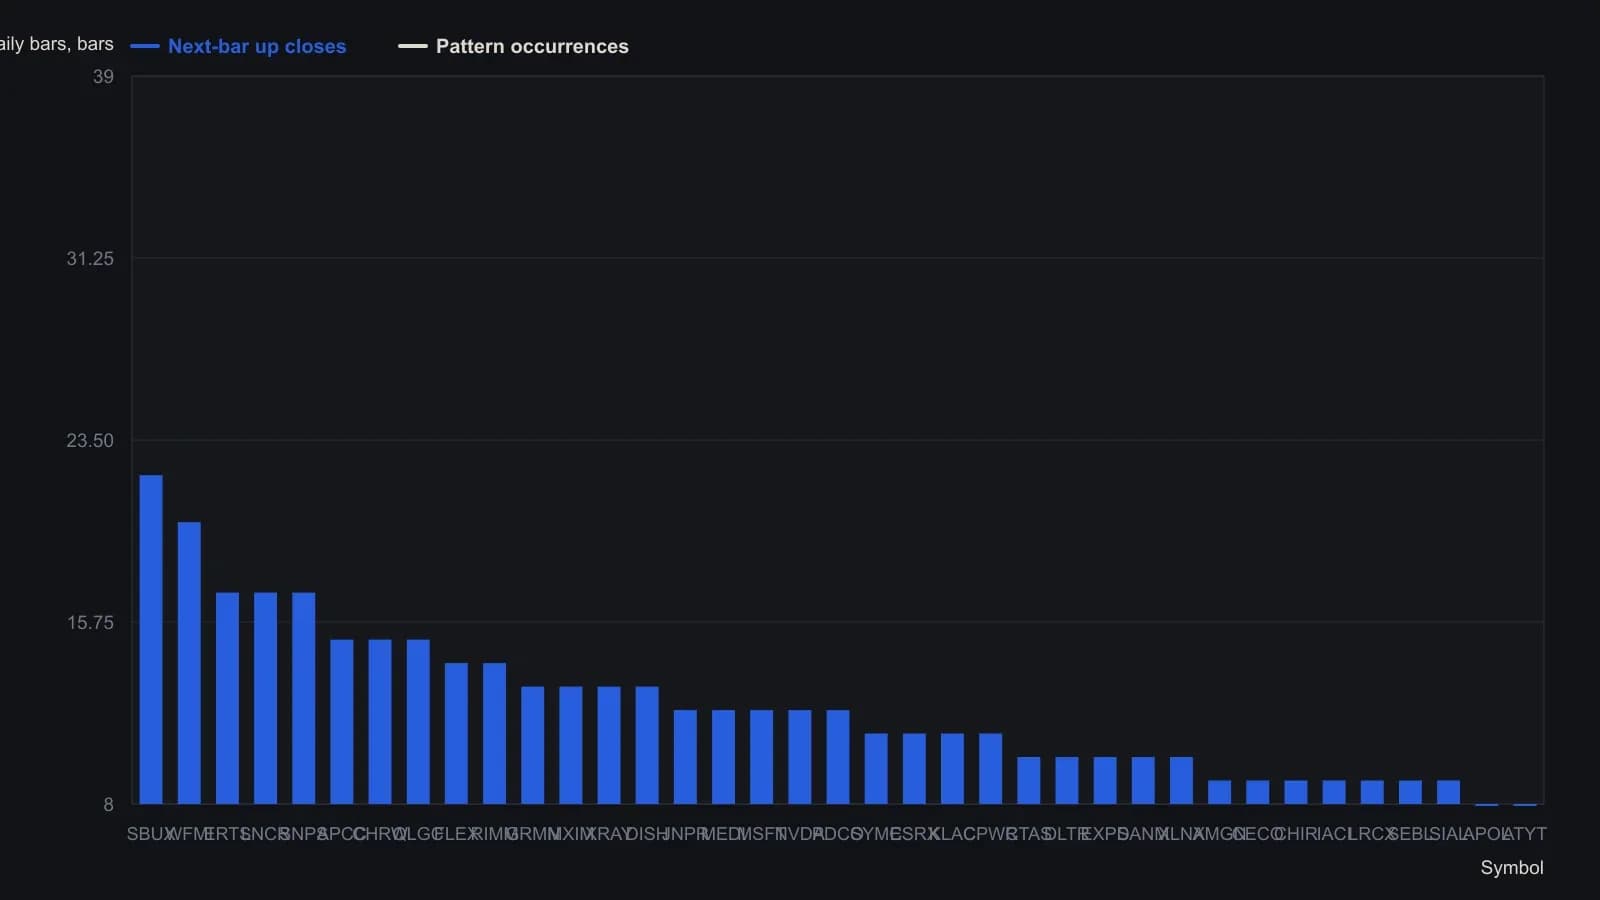
msPatt&Stat2 on daily bars; Events is how often the latest four-digit open-high-low-close zone code appeared in the last 500 bars, and Up is how often the bar after that code closed higher. The screen is sorted by Up.
Reuse the same four-tuple in a later-change count
The same zone construction can be reused to count a chosen four-tuple on a per-security basis and to measure the average percentage change a stated number of days later. A market-scan filter can isolate an explicit example tuple such as open-zone 3, high-zone 5, low-zone 3, close-zone 5, then summarize how often that tuple occurred and the average net change five days later.
All readings on this track · 25 readings
- 1986Construct a decision procedure that revises itself
- 1989Finish the volume checklist before scoring the breakout
- 1989Constructing supervised forecasts on moving averages
- 1991Candlestick labels as stacked construction tests
- 1992Walk-forward evaluation of weekly price-change patterns
- 1993RSI price pattern templates and open interest
- 1994Constructing a dual-net day-ahead index direction forecast
- 1994A clocked stochastic second crest with a window-high stop
- 1996Volatility-ratio, inside-day and narrow-range-4 entry construction
- 1998Sliding-window correlation for cup-and-handle construction
- 2000Constructing rectangles for breakout hypotheses
- 2001Turning one candle into a ranked numeric object
- 2002Fuzzy-scored chart patterns as testable rules
- 2002From hot-zones to an open-close-matrix
- 2003Volume pressure and a band-clearing breakout case
- 2004Evaluating chart patterns against price objectives
- 2004Cobweb turning points from price structure
- 2005Hybrid decision trees and pattern recognition for trend rules
- 2005Two-bar zone codes for testable pattern systems
- 2005Price bar pattern construction and next-bar frequency
- 2008Observe markets before following pattern or system rules
- 2012Treat a four-leg Fibonacci completion as an unpaid hypothesis
- 2014Hidden three-channel regression signals for stock and call option entries
- 2014A shared daily-chart-level framework for session trades and swing holds
- 2015Condensed candlestick signatures