2002issue C121-6
From hot-zones to an open-close-matrix
Editorial reading: construct the system in two stages. First partition a daily bar into six volatility-anchored hot-zones. Then record the next session's open and close on that grid so a mechanical-trading-system can use the open-close-matrix as a roadmap after a key-reversal-up.
- Five zone-points split a daily bar into six hot-zones: the high plus a volatility-offset, the high, the midpoint of high and low, the low, and the low minus a volatility-offset.
- The construction starts from a key-reversal-up, then assigns the next session's open and close to the same zone grid.
- A screening function encodes each open-zone and close-zone pair as one of 36 codes so an open-close-matrix can count frequencies and mark which opening zones to trade or skip.
- On the illustrated DAX sample, 39.29 percent of next-day opens after the pattern fell in the mid-to-high hot-zone, more often than in any other opening zone.
Two stages, labelled as editorial
This archive article is written as an editorial construction guide. The first stage turns one daily bar into a small set of volatility-anchored hot-zones. The second stage converts the next session's open-to-close path into a lookup table that can decide whether to enter, exit, or stand aside.
The historical workflow below stays inside that two-stage frame. It does not add a separate signal method or a different zone definition.
Five zone-points make six hot-zones
A daily bar can be partitioned into six hot-zones using five zone-points: the high plus a volatility-offset, the high, the midpoint of high and low, the low, and the low minus a volatility-offset.
The volatility-offset that extends the outer hot-zones is 30 percent of a 10-period average true range.
Start from a key-reversal-up
The construction starts from a key-reversal-up. That pattern is a two-bar setup in which the current low undercuts the prior low and the current close finishes above the prior close.
After the pattern, the next session's open is assigned to a hot-zone, and the same zone grid is used to record where that session then closes. Pattern-recognition, in this construction, is that classification of the open and close into discrete hot-zones.
Encode 36 pairs into an open-close-matrix
On the illustrated DAX sample, 39.29 percent of next-day opens after the pattern fell in the mid-to-high hot-zone, more often than in any other opening zone.
A screening function encodes each open-zone and close-zone pair as one of 36 discrete codes so the frequencies can be counted mechanically. The resulting open-close-matrix is intended as a roadmap for choosing which opening zones to trade and which to skip after the same pattern.
A rule-based-entry then fires only when the named pattern is present and the subsequent open lands in a preselected hot-zone. A mechanical-trading-system maps that pattern, the opening hot-zone, and optional execution filters into a long, short, or no-trade decision.
A historical DAX count
A sample mechanical strategy on DAX index futures from 16 August 1991 through 20 September 2002 produced 115 trades with 51.30 percent profitable.
Editorial caution: that count belongs to the historical sample. It is not a claim about present-day performance.
DAX close-zone odds after a key-reversal-up
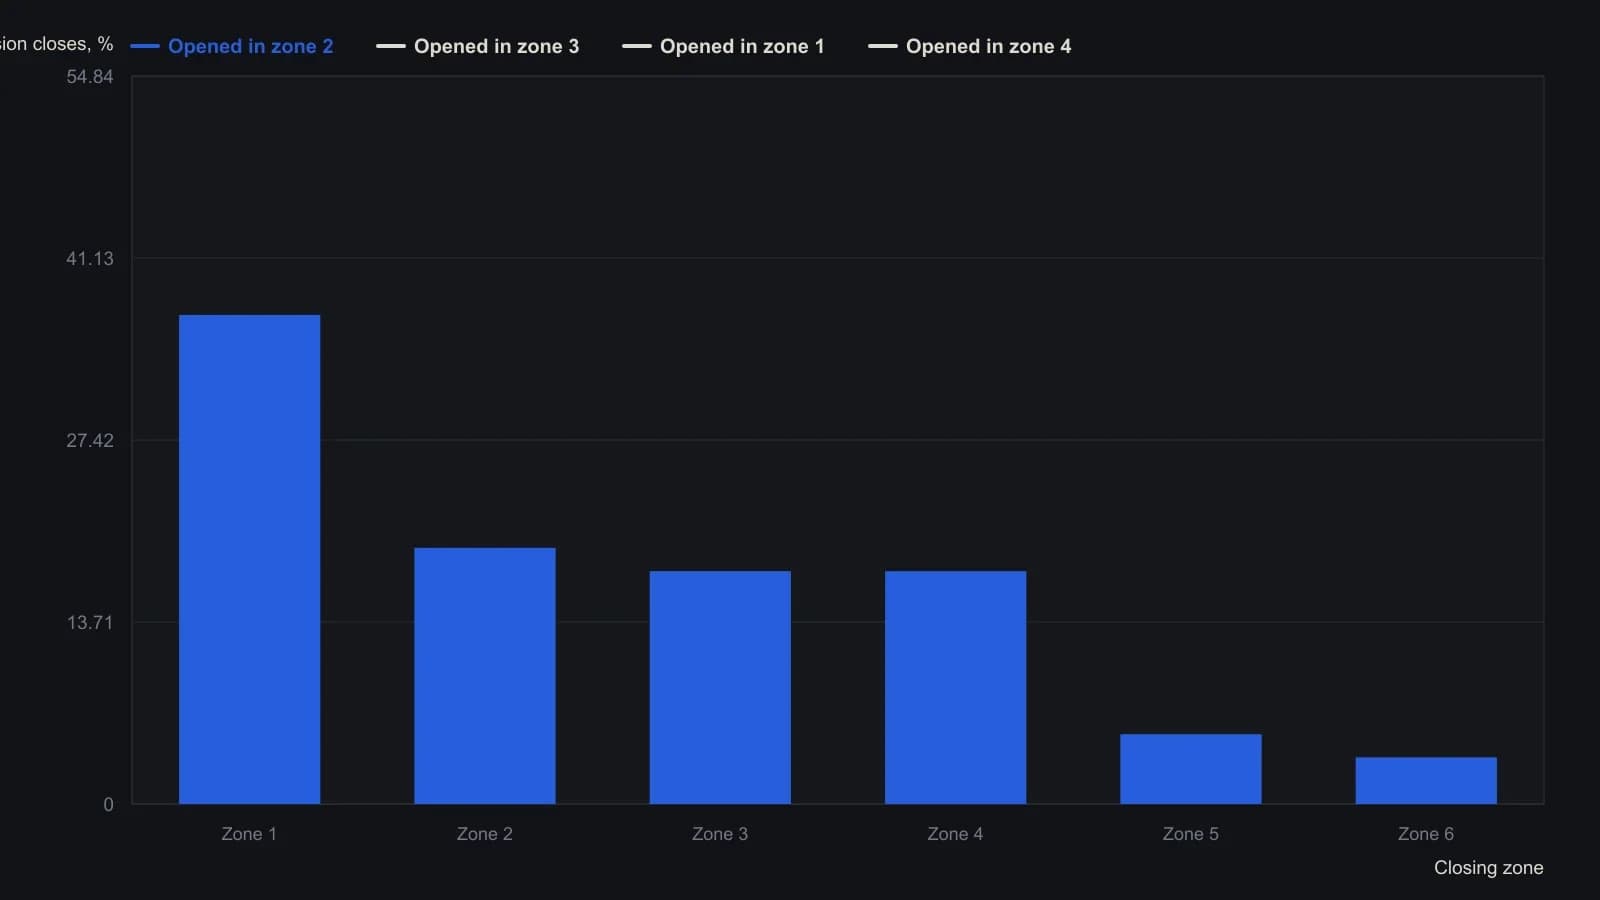
Zones use 30 percent of a 10-period ATR above the prior high and below the prior low, plus that bar’s high, midpoint and low. Opening zones 5 and 6 had only four observations each in the printed matrix and are omitted.
All readings on this track · 25 readings
- 1986Construct a decision procedure that revises itself
- 1989Finish the volume checklist before scoring the breakout
- 1989Constructing supervised forecasts on moving averages
- 1991Candlestick labels as stacked construction tests
- 1992Walk-forward evaluation of weekly price-change patterns
- 1993RSI price pattern templates and open interest
- 1994Constructing a dual-net day-ahead index direction forecast
- 1994A clocked stochastic second crest with a window-high stop
- 1996Volatility-ratio, inside-day and narrow-range-4 entry construction
- 1998Sliding-window correlation for cup-and-handle construction
- 2000Constructing rectangles for breakout hypotheses
- 2001Turning one candle into a ranked numeric object
- 2002Fuzzy-scored chart patterns as testable rules
- 2002From hot-zones to an open-close-matrix
- 2003Volume pressure and a band-clearing breakout case
- 2004Evaluating chart patterns against price objectives
- 2004Cobweb turning points from price structure
- 2005Hybrid decision trees and pattern recognition for trend rules
- 2005Two-bar zone codes for testable pattern systems
- 2005Price bar pattern construction and next-bar frequency
- 2008Observe markets before following pattern or system rules
- 2012Treat a four-leg Fibonacci completion as an unpaid hypothesis
- 2014Hidden three-channel regression signals for stock and call option entries
- 2014A shared daily-chart-level framework for session trades and swing holds
- 2015Condensed candlestick signatures