1992issue C061-5
Walk-forward evaluation of weekly price-change patterns
Editorial. A memory-in-prices hypothesis is treated as a three-gate lab: fit a pattern learner on a fixed weekly-change-lookback, use the training-test-gap across successive passes to reject sample-specific associations, then freeze one weekly hold-or-stand-aside rule and score it only on a later unused window.
- Neural networks were presented as unprogrammed learners that adjust internal connection strengths until computed outputs fall inside a chosen tolerance of paired target events.
- A weekly-change-lookback of 10 consecutive weekly price changes was the sole basis for a next-week forecast of a broad stock index.
- Across most of 100 fitting passes, the training-test-gap was read as associations tailored to the known sample rather than relationships that would persist outside it.
- After that gap closed, pass 88 was frozen as the working model and weekly hold-or-stand-aside signals were scored on the fitting span plus a later unused 26-week window.
Unprogrammed learners
Neural networks were presented as unprogrammed learners that adjust internal connection strengths until computed outputs fall inside a chosen tolerance of paired target events.
A toy addition task
A toy addition task used two randomly generated integer series from 0 to 10 as inputs, their sum as the target, 80 percent of cases for training, 20 percent withheld, and a plus-or-minus 10 percent acceptance band.
On that toy task, fewer than half of training and withheld outputs were acceptable after the first pass. About 90 percent were acceptable after 20 further passes. Every training and withheld case fell inside the band after 30 additional passes.
A weekly-change-lookback as the market test
The market test used 10 consecutive weekly price changes as the sole basis for a forecast of the following week's change in a broad stock index. That fixed run is the weekly-change-lookback. Pattern recognition maps those ordered price observations over a stated weekly sampling interval and lookback onto a next-period estimate, then checks that estimate against a withheld result.
The learner was fit on 233 weeks from 18 March 1987 through 28 August 1991, with 47 randomly selected weeks, equal to 20 percent of that span, withheld from training. Those 47 weeks were a held-out-window, reserved from weight updates so forecast checks were not taken from the same observations used to train the learner. An unused 26-week window from 4 September 1991 through 26 February 1992 was reserved for checking forecasts after training and withheld testing had already ended.
The training-test-gap as a rejection gate
The training-test-gap is the spread between in-sample hit rate and withheld-sample hit rate across fitting passes. A lasting spread is a warning that associations may be sample-specific.
Across most of 100 fitting passes, training-set hit rates exceeded withheld-set hit rates, which was read as associations tailored to the known sample rather than relationships that would persist outside it. The training-withheld gap closed between passes 87 and 92, and pass 88 was selected as the working model.
A frozen weekly rule on a later unused stretch
On the selected pass, next-week change forecasts on average slightly overstated the realized weekly index move during the training and withheld window.
Weekly hold-or-stand-aside signals taken from the next-week forecast were compared with the same index over the fitting span plus the unused 26-week window. Forecast quality was judged weakest in the stretch immediately after Iraq invaded Kuwait.
Editorial. TradersWeek labels those hold-or-stand-aside actions a momentum-strategy because they treat recent directional price change as the tradable state over a weekly holding period. The later unused stretch is labelled walk-forward-analysis because the same rule set is frozen after fitting and scored on a later unused window whose horizon is the system holding period. Those labels are not attributed to the archive.
Training versus withheld weekly-change hit rate by run
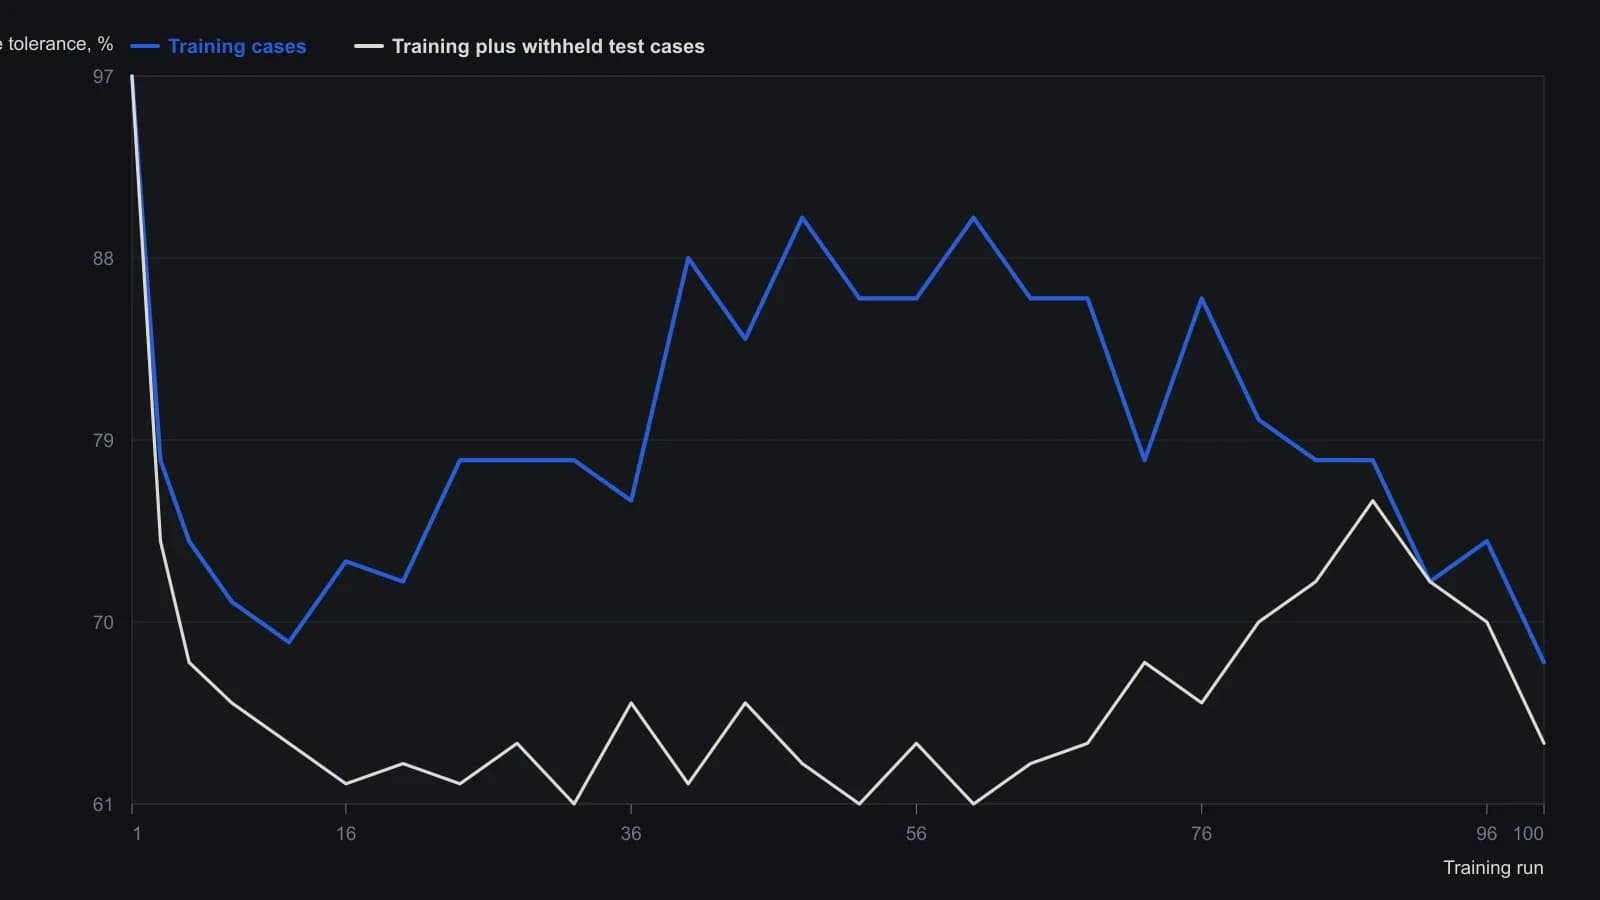
Percent of outputs counted correct if they fell inside the article’s plus-or-minus 10–50% tolerance. Training used 186 of 233 S&P 500 weeks (March 18, 1987–August 28, 1991); 47 weeks were withheld. Digitized from the raster; coordinates are approximate.
All readings on this track · 25 readings
- 1986Construct a decision procedure that revises itself
- 1989Finish the volume checklist before scoring the breakout
- 1989Constructing supervised forecasts on moving averages
- 1991Candlestick labels as stacked construction tests
- 1992Walk-forward evaluation of weekly price-change patterns
- 1993RSI price pattern templates and open interest
- 1994Constructing a dual-net day-ahead index direction forecast
- 1994A clocked stochastic second crest with a window-high stop
- 1996Volatility-ratio, inside-day and narrow-range-4 entry construction
- 1998Sliding-window correlation for cup-and-handle construction
- 2000Constructing rectangles for breakout hypotheses
- 2001Turning one candle into a ranked numeric object
- 2002Fuzzy-scored chart patterns as testable rules
- 2002From hot-zones to an open-close-matrix
- 2003Volume pressure and a band-clearing breakout case
- 2004Evaluating chart patterns against price objectives
- 2004Cobweb turning points from price structure
- 2005Hybrid decision trees and pattern recognition for trend rules
- 2005Two-bar zone codes for testable pattern systems
- 2005Price bar pattern construction and next-bar frequency
- 2008Observe markets before following pattern or system rules
- 2012Treat a four-leg Fibonacci completion as an unpaid hypothesis
- 2014Hidden three-channel regression signals for stock and call option entries
- 2014A shared daily-chart-level framework for session trades and swing holds
- 2015Condensed candlestick signatures