1993issue C081-10
RSI price pattern templates and open interest
A 14-period relative strength index marks overbought or oversold conditions, divergence, and distinct oscillator signatures across decline shapes. The reversal template is lower price lows against a rising support zone, a channel-contained oscillator spike, and a later pause after prices accelerate. Daily volume, open interest, and a paired 3-day and 5-day moving average check whether a familiar shape still has participation.
- A 14-period relative strength index marks overbought or oversold conditions and divergence, and different decline shapes carry distinct oscillator signatures.
- The reversal template is lower price lows that probe a rising support zone, a channel-contained oscillator spike used for timing, and a later post-acceleration consolidation.
- Daily volume and open interest, with a paired 3-day and 5-day moving average, serve as participation checks that can veto look-alikes that never confirm.
- Pattern-failure appears as weak, inside, or resistance-capped follow-through, so the exit is whether price remains inside the model rather than a fixed tick budget.
Oscillator signatures in a decline
A 14-period relative strength index is applied to mark overbought or oversold conditions and divergence, and different decline shapes are described as carrying distinct oscillator signatures. Divergence is price printing lower lows while the oscillator trends higher and builds a rising support zone.
The reversal template
The reversal template is specified as lower price lows, a rising oscillator support zone that those lows probe, a channel-contained bounce that spikes the oscillator, and the first consolidation after prices accelerate. Pattern recognition matches repeating combinations of price-channel behavior and oscillator shape, including completed, incomplete, and failed templates.
The rising support zone is a gradually higher floor under the oscillator that successive price lows probe without breaking. The oscillator spike is a brief upward burst in the oscillator from a bounce that stays inside the existing down channel and is used for timing. Post-acceleration consolidation is the first pause after covering pressure lifts and price accelerates, treated as a later window rather than the initial template.
Bond windows
Treasury-bond chart windows show new price lows occurring while the oscillator trends higher, then an upward spike followed by the oscillator settling toward its rising support line. One bond sequence after a two-day oscillator spike traces a 21-day range, holds a retest of the low, and only later resumes after a subsequent consolidation.
Lumber windows
A lumber window with nearly flat closes and a rising oscillator produced a spike, then several apparent completions before a prior low near 195.60 was retested and held. A later lumber window is classified as an unrealized template because the oscillator did not form rising support, even though an upward spike still appeared and a long-horizon oscillator floor near 28 recurred.
Stops defined by the model
Daily ranges leading into the template are used to infer a stop just outside the formation, so the exit is defined by whether price remains inside the model rather than by a fixed tick budget alone.
Incomplete and failed templates
A gold sequence that looked complete after an oscillator spike and a shelf-like support pause then broke the template on a narrow inside day and a five-day shallow drift, and a later repeat of the same unfinished shape is treated as one larger pattern. A lumber sequence with a four-day oscillator spike never generated enough follow-through to clear a nearby 155 resistance band that held shorts and resting orders, and that weak acceleration is presented as a failure cue. Pattern-failure is weak, inside, or resistance-capped follow-through after a familiar template, so the setup is treated as incomplete.
Participation checks
Daily volume and open interest are named as participation checks on these templates, with a paired 3-day and 5-day moving average used as a near-term confirmation filter. Open interest analysis uses daily open interest, with volume, as a participation check on whether a price-and-oscillator template still has market commitment.
14-period RSI on December 1987 T-bonds
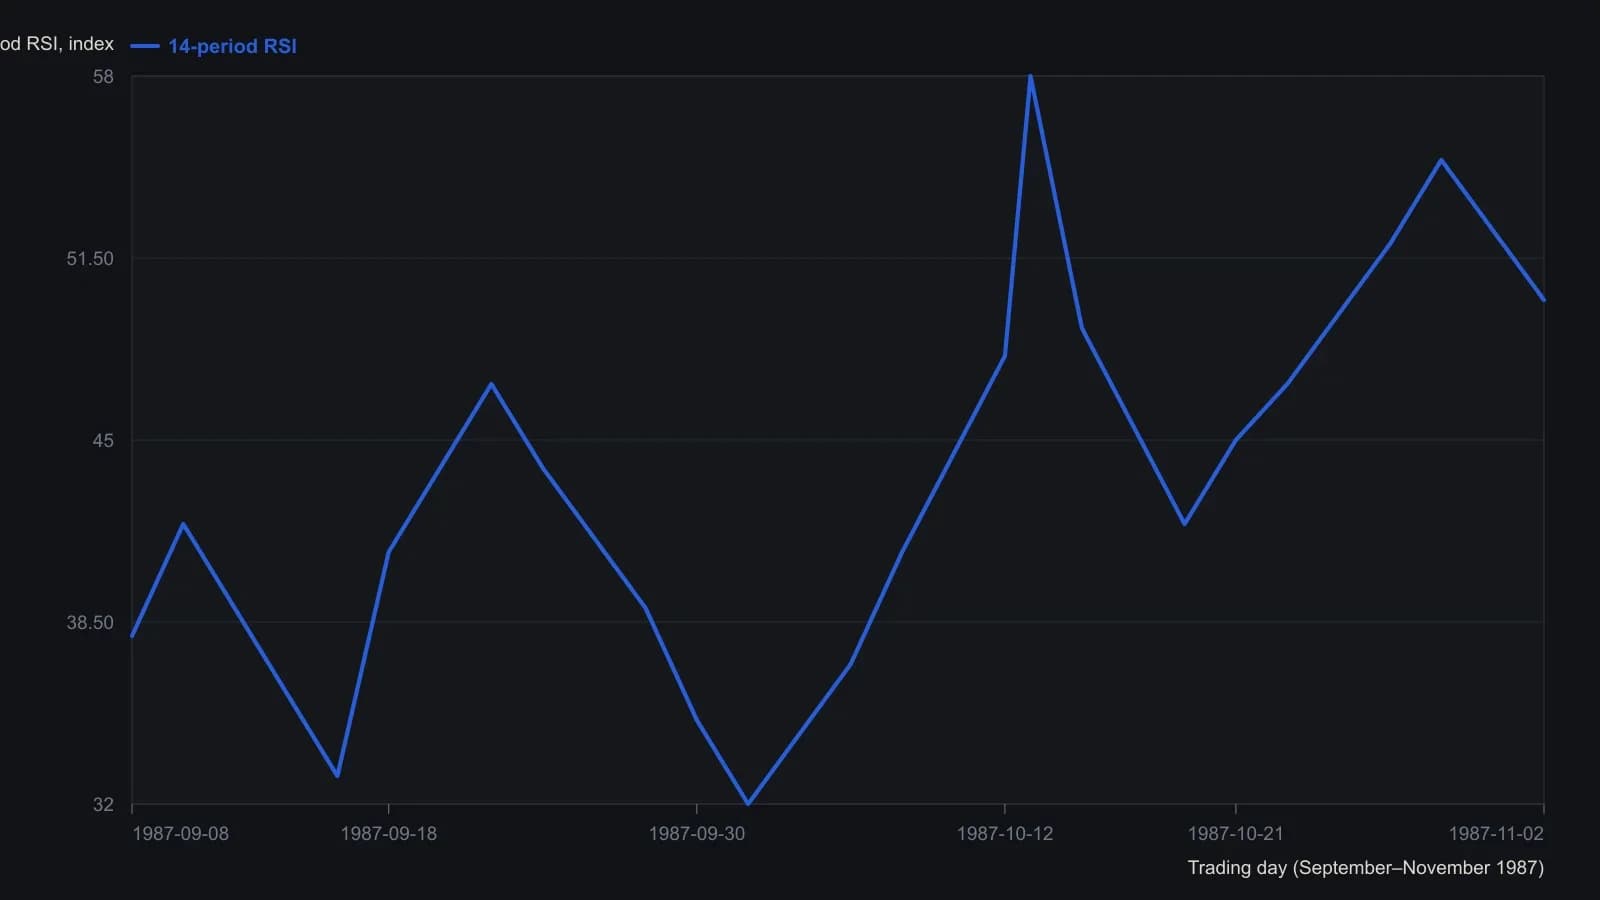
Daily closes are not tabulated in the article. RSI points are approximate readings from the printed 0–100 pane; the price window discussed in the source is 8 September through 19 October 1987, with the oscillator spike dated 13 October.
All readings on this track · 25 readings
- 1986Construct a decision procedure that revises itself
- 1989Finish the volume checklist before scoring the breakout
- 1989Constructing supervised forecasts on moving averages
- 1991Candlestick labels as stacked construction tests
- 1992Walk-forward evaluation of weekly price-change patterns
- 1993RSI price pattern templates and open interest
- 1994Constructing a dual-net day-ahead index direction forecast
- 1994A clocked stochastic second crest with a window-high stop
- 1996Volatility-ratio, inside-day and narrow-range-4 entry construction
- 1998Sliding-window correlation for cup-and-handle construction
- 2000Constructing rectangles for breakout hypotheses
- 2001Turning one candle into a ranked numeric object
- 2002Fuzzy-scored chart patterns as testable rules
- 2002From hot-zones to an open-close-matrix
- 2003Volume pressure and a band-clearing breakout case
- 2004Evaluating chart patterns against price objectives
- 2004Cobweb turning points from price structure
- 2005Hybrid decision trees and pattern recognition for trend rules
- 2005Two-bar zone codes for testable pattern systems
- 2005Price bar pattern construction and next-bar frequency
- 2008Observe markets before following pattern or system rules
- 2012Treat a four-leg Fibonacci completion as an unpaid hypothesis
- 2014Hidden three-channel regression signals for stock and call option entries
- 2014A shared daily-chart-level framework for session trades and swing holds
- 2015Condensed candlestick signatures