2012issue C0454-59
Treat a four-leg Fibonacci completion as an unpaid hypothesis
Archive notes specify Gartley, bat, butterfly, and crab structures by stacked Fibonacci ratios and treat point D as a projected band. A 14-period relative strength index is offered as a separate state filter. Editorial view: neither the band nor the oscillator reading is a forecast until the scan reports nonmatches, population size, and whether a delayed turn after tagging D still counts.
- Four-leg XABCD structures labeled Gartley, bat, butterfly, or crab are specified by chosen Fibonacci ratios on successive swings, not by visual resemblance alone.
- Completion at point D is a band of projected prices. Clustered independent projections bound the potential reversal zone.
- A reported match count does not establish robustness unless the nonmatch count and the searched population size are also stated.
- A 14-period 70/30 relative strength index is a second, separable state filter, not a restatement of the geometric scan.
Four-leg completions start as ratio rules
Four-leg XABCD structures labeled Gartley, bat, butterfly, or crab are specified by chosen Fibonacci ratios on successive swings rather than by visual resemblance alone. Fibonacci retracement means scaling a completed price swing by sequence ratios such as 0.382, 0.618, or 0.786 to locate a later pullback or extension. Each later swing is obtained by scaling a prior price change by Fibonacci coefficients such as 0.382, 0.618, or 0.886.
An editorial reading treats that stacked ratio rule as an unpaid hypothesis, not as a finished forecast.
Point D is a band, not a print
Completion at point D is specified as a band of projected prices, not a single print. A Gartley structure is a four-leg XABCD geometry whose completion is defined by stacked Fibonacci conditions, often including an equal AB and CD swing. One typical Gartley band stacks that AB-CD equality with a 0.786 retracement of XA and a 1.414 extension of BC.
Clustering of several independent Fibonacci projections is treated as a stronger reversal hypothesis, with the outer projections bounding the completion zone. That band is the potential reversal zone: the price band formed by the highest and lowest Fibonacci projections that mark where a four-leg structure is said to complete.
Three Gartley projections that form the QQQ completion band
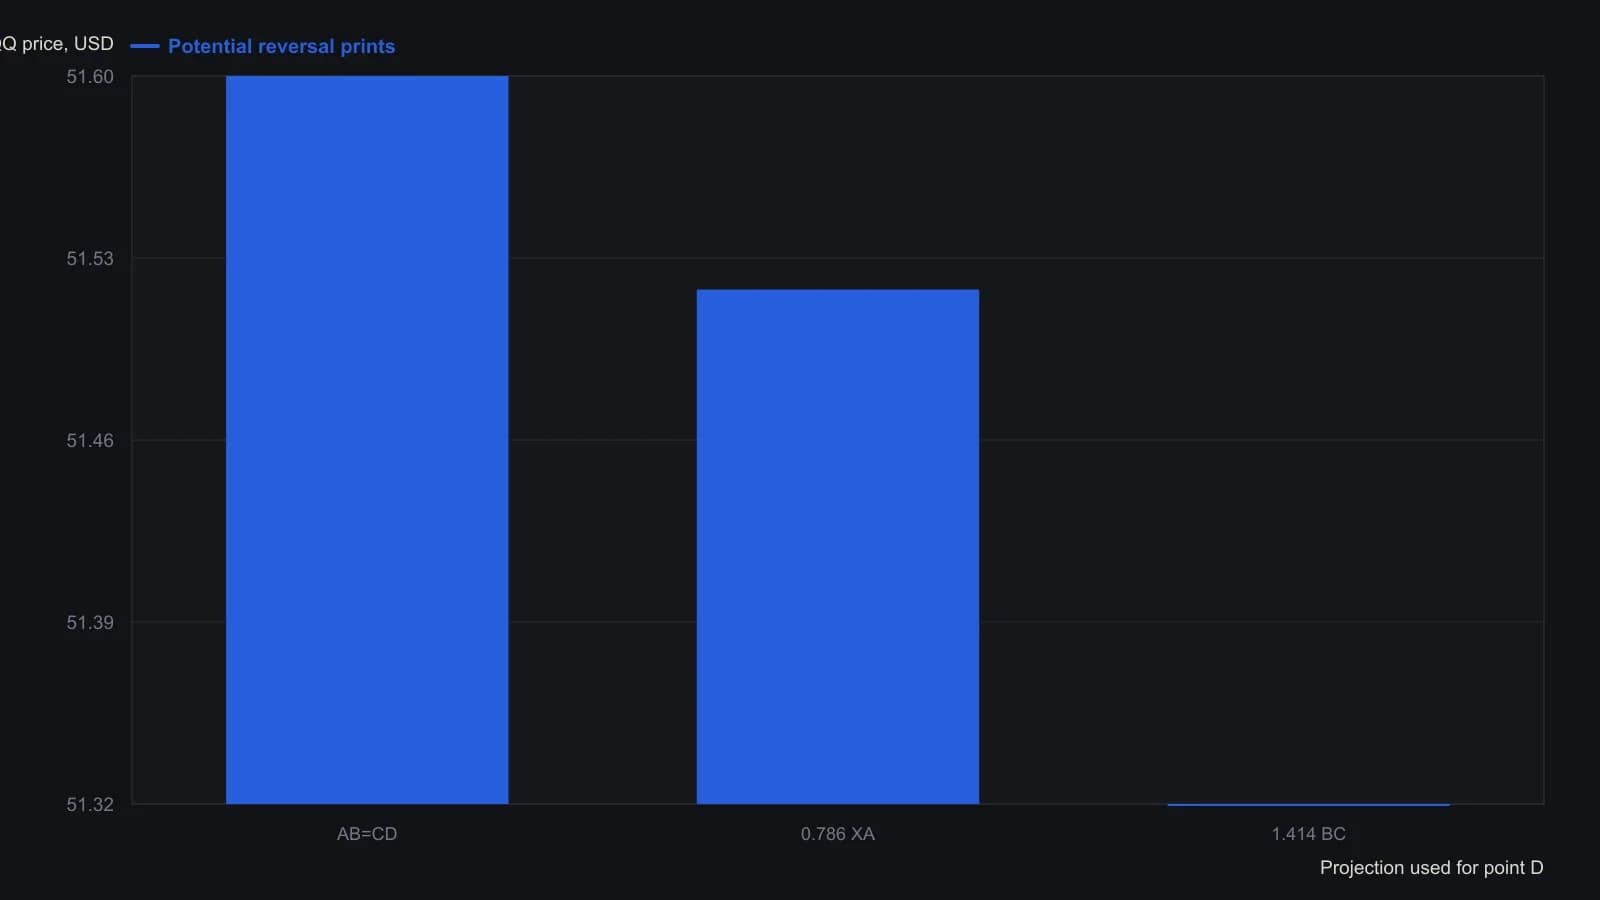
The 1.414-of-BC tag is clipped at the screenshot edge, so that print is given only to the two decimals still visible. The candlestick path has no priced vertical axis and was not recovered.
A scan is incomplete without misses
Pattern recognition, in this setting, means scanning ordered bars for named multi-swing geometries and judging those hits only against the full search population, including nonmatches. A reported match count does not establish robustness unless the corresponding nonmatch count and the searched population size are also stated.
A validation rule must say whether a delayed turn, after price only tags the D ratio, still counts as a completed reversal. Editorial view: without those three disclosures the geometric hit remains unpaid.
Relative strength is a second test
A 14-period relative strength index using 70 as overbought and 30 as oversold is proposed as a separate state filter on the same reversal setups. Relative strength index is a bounded oscillator on a fixed lookback of closes, commonly read at 70 and 30 for overbought and oversold states. Those overbought-oversold extremes are used as a second witness that a Fibonacci completion is occurring away from mid-range conditions.
Because the geometric scan is built independently of the oscillator, adding 14-period 70/30 relative-strength logic is a second, separable test rather than a restatement of the same signal. The described pattern-plus-indicator workflow offered no automated backtest of Gartley, bat, or butterfly combinations.
All readings on this track · 25 readings
- 1986Construct a decision procedure that revises itself
- 1989Finish the volume checklist before scoring the breakout
- 1989Constructing supervised forecasts on moving averages
- 1991Candlestick labels as stacked construction tests
- 1992Walk-forward evaluation of weekly price-change patterns
- 1993RSI price pattern templates and open interest
- 1994Constructing a dual-net day-ahead index direction forecast
- 1994A clocked stochastic second crest with a window-high stop
- 1996Volatility-ratio, inside-day and narrow-range-4 entry construction
- 1998Sliding-window correlation for cup-and-handle construction
- 2000Constructing rectangles for breakout hypotheses
- 2001Turning one candle into a ranked numeric object
- 2002Fuzzy-scored chart patterns as testable rules
- 2002From hot-zones to an open-close-matrix
- 2003Volume pressure and a band-clearing breakout case
- 2004Evaluating chart patterns against price objectives
- 2004Cobweb turning points from price structure
- 2005Hybrid decision trees and pattern recognition for trend rules
- 2005Two-bar zone codes for testable pattern systems
- 2005Price bar pattern construction and next-bar frequency
- 2008Observe markets before following pattern or system rules
- 2012Treat a four-leg Fibonacci completion as an unpaid hypothesis
- 2014Hidden three-channel regression signals for stock and call option entries
- 2014A shared daily-chart-level framework for session trades and swing holds
- 2015Condensed candlestick signatures