2002issue C091-5
Fuzzy-scored chart patterns as testable rules
Chart patterns that look alike still fail exact definitional matches. A fuzzy-pattern-indicator writes the desired path in slope words, scores the current window from zero to one, and feeds mechanical-threshold-rules that a genetic-pattern-search can retune.
- Chart patterns that look alike still fail exact definitional matches, so recognition can be framed as an imprecise matching task rather than a binary template check.
- A fuzzy-pattern-indicator can scan a close series or another series such as RSI or MACD and report a membership-score from zero to one for the current window.
- Segment-code integers encode slope language: two means rises sharply, one means rises, zero means remains steady, minus one means drops, and minus two means drops sharply.
- Mechanical-threshold-rules fire from those scores, overlapping partial firings collapse through defuzzification, and a genetic-pattern-search can change thresholds while leaving seed pattern encodings unchanged.
Imprecise matching instead of a binary template
Chart patterns that look alike still fail exact definitional matches, so recognition can be framed as an imprecise matching task rather than a binary template check.
Approximate verbal slope language can describe a desired shape so a scan can report when a time series resembles that shape. That scan is a fuzzy-pattern-indicator, which scores how closely a recent price or indicator window matches a verbal multi-segment shape, typically on a zero-to-one scale.
Segment codes and the membership score
A fuzzy-pattern-indicator may be applied to a close series or to another series such as RSI or MACD, and it reports a membership-score from zero to one for the current window.
Segment parameters use integer segment-code labels in which two means rises sharply, one means rises, zero means remains steady, minus one means drops, and minus two means drops sharply. Each segment-code encodes slope language for one stretch of the pattern.
Long-side and short-side seed paths
One long-side example scanned a two-segment close path of a rise followed by a sharp drop over a 10-day window, using a five-point change to define sharpness.
One short-side example scanned a two-segment close path of a sharp rise followed by a steady stretch over a 10-day window with the same five-point sharpness scale.
Thresholds and overlapping rule firings
A mechanical-threshold-rule is a fixed comparison that turns a membership-score into an entry, exit, or abstention decision. A mechanical long rule in the example fired when the long-side score exceeded 0.5, with a parallel threshold rule on the short-side score.
When an observation sits in overlapping membership ranges, multiple rules can fire at partial strength. Defuzzification collapses those overlapping partial firings into one numeric control or signal value. In this workflow a center-of-mass step converted the strengths into that single numeric output.
Search over encodings and thresholds
A genetic-pattern-search can start from a seed pattern encoding, generate mated and mutated variants of segment-codes, window length, and sharpness, and retain children that pass a fitness test.
In the reported optimization the original long and short pattern encodings were left unchanged while the long threshold moved from 0.5 to 0.3 and the short threshold moved to 0.07.
Biogen daily prices the fuzzy scanners were marking
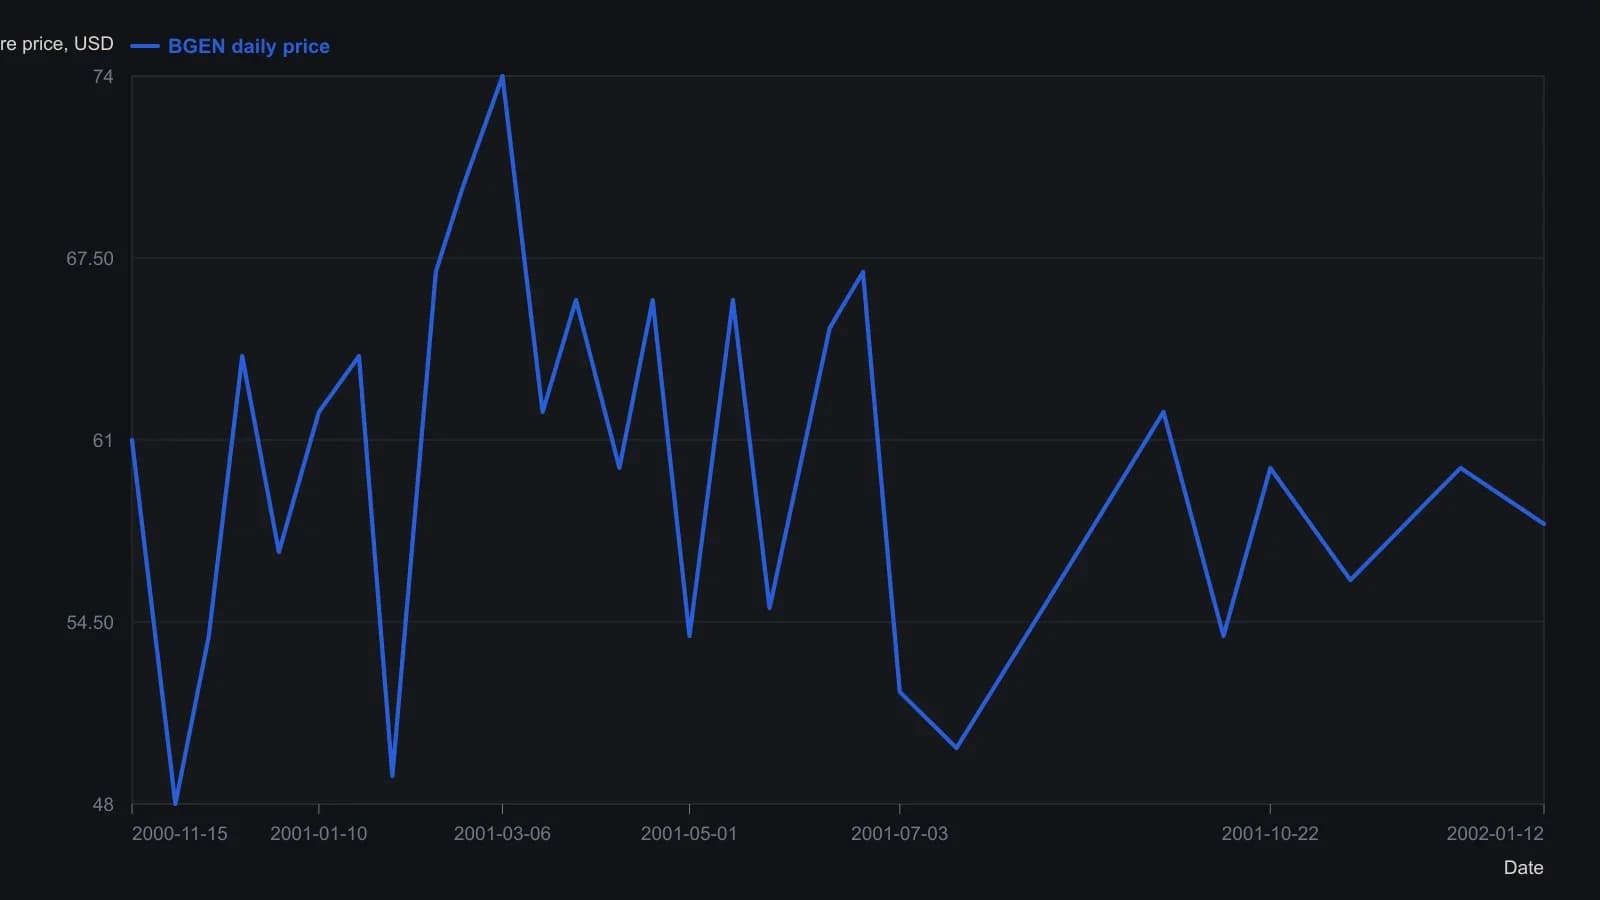
Closes were digitized from the printed daily-bar scale to the nearest dollar; the raster does not support finer precision.
All readings on this track · 25 readings
- 1986Construct a decision procedure that revises itself
- 1989Finish the volume checklist before scoring the breakout
- 1989Constructing supervised forecasts on moving averages
- 1991Candlestick labels as stacked construction tests
- 1992Walk-forward evaluation of weekly price-change patterns
- 1993RSI price pattern templates and open interest
- 1994Constructing a dual-net day-ahead index direction forecast
- 1994A clocked stochastic second crest with a window-high stop
- 1996Volatility-ratio, inside-day and narrow-range-4 entry construction
- 1998Sliding-window correlation for cup-and-handle construction
- 2000Constructing rectangles for breakout hypotheses
- 2001Turning one candle into a ranked numeric object
- 2002Fuzzy-scored chart patterns as testable rules
- 2002From hot-zones to an open-close-matrix
- 2003Volume pressure and a band-clearing breakout case
- 2004Evaluating chart patterns against price objectives
- 2004Cobweb turning points from price structure
- 2005Hybrid decision trees and pattern recognition for trend rules
- 2005Two-bar zone codes for testable pattern systems
- 2005Price bar pattern construction and next-bar frequency
- 2008Observe markets before following pattern or system rules
- 2012Treat a four-leg Fibonacci completion as an unpaid hypothesis
- 2014Hidden three-channel regression signals for stock and call option entries
- 2014A shared daily-chart-level framework for session trades and swing holds
- 2015Condensed candlestick signatures