2014issue C0516-23
Hidden three-channel regression signals for stock and call option entries
A channel is three numbers: lookback length in days, the slope of the best-fit regression line, and a width percent that must enclose every close in that window. Pattern recognition then keeps one up, one down, and one sideways window so the same hidden pattern can fire a Momentum strategy stock signal or an Option income strategy call overlay.
- Each channel is defined by lookback length in days, the slope of the best-fit regression line, and a width percent that must enclose every close inside that window.
- Scanning every integer lookback from a start day to an end day produces one up channel, one down channel, and one sideways channel, selected by highest slope, lowest slope, and slope nearest zero.
- Nine raw channel parameters become six normalized inputs when the best up and best down width, slope, and length values are divided by the matching sideways-channel values.
- The same recognition process can emit a buy or sell signal for the underlying security or for a call on that security as soon as the hidden pattern is identified.
Three parameters define a channel
A channel is defined by three parameters: lookback length in days, slope of the best-fit regression line, and a width percent that must enclose every close inside that window. The historical workflow treated those windows as the Pattern recognition object: ordered closes over a chosen lookback, not a freehand drawing.
One up, one down, and one sideways window
Scanning every integer lookback from a start day to an end day produces one up channel, one down channel, and one sideways channel. The three survivors are selected by highest slope, lowest slope, and slope nearest zero.
Two illustrated configurations
On one illustrated date, the selected Hornbeck channels were a 40-day sideways window, a 63-day up window, and a 20-day down window. On the same date, General Electric showed a different configuration: a 54-day down channel, a 38-day sideways channel, and a 29-day up channel.
Hornbeck Offshore daily closes with three regression windows
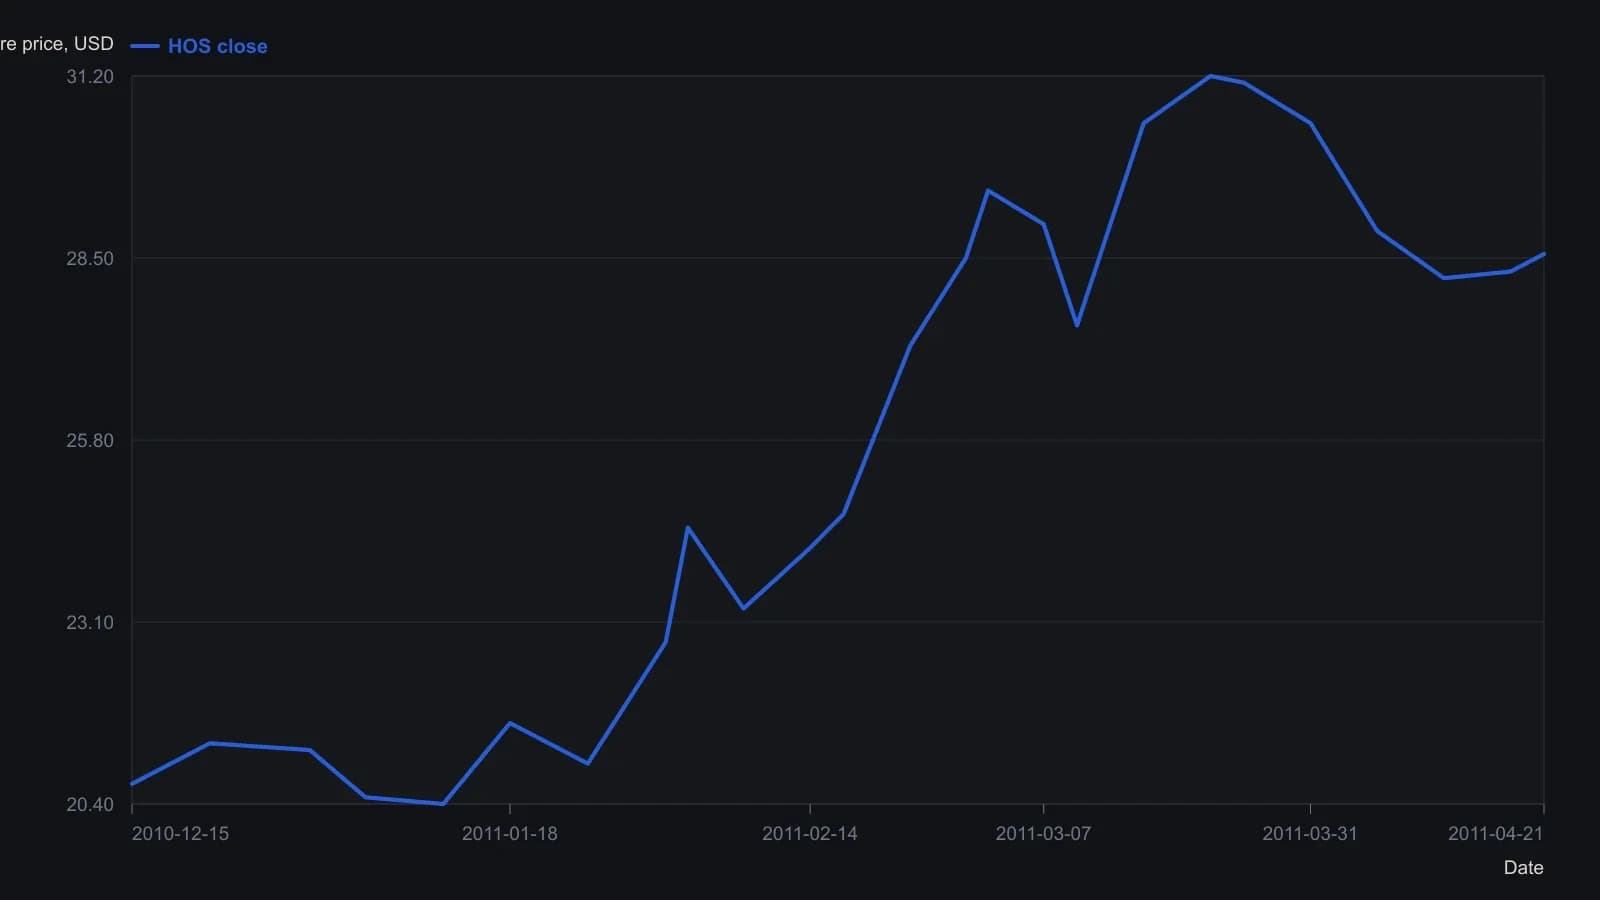
Each window is 10 percent wide so every close in that lookback stays inside the band. On the last bar the figure prints open 28.33, high 28.81, low 28.17, close 28.56. Lookbacks kept that day are 63 (up), 40 (sideways) and 20 (down).
Nine raw values become six normalized inputs
Each of the three windows still carries length, slope, and width, so the scan begins with nine raw channel parameters. Those nine values are reduced to six normalized inputs by dividing the best up and best down width, slope, and length values by the corresponding sideways-channel values.
The same pattern can fire a stock or a call
The same recognition process can emit a buy or sell signal for either the underlying security or a call on that security as soon as the hidden pattern is identified. In a two-year stock test of 97 names, 35 issues had no losing trades and the average holding period was 33 days.
The option overlay used the nearest expiration with at least 20 days remaining, a call delta between 0.4 and 0.8, and the strike closest to 5 percent in-the-money that still met the delta band.
All readings on this track · 25 readings
- 1986Construct a decision procedure that revises itself
- 1989Finish the volume checklist before scoring the breakout
- 1989Constructing supervised forecasts on moving averages
- 1991Candlestick labels as stacked construction tests
- 1992Walk-forward evaluation of weekly price-change patterns
- 1993RSI price pattern templates and open interest
- 1994Constructing a dual-net day-ahead index direction forecast
- 1994A clocked stochastic second crest with a window-high stop
- 1996Volatility-ratio, inside-day and narrow-range-4 entry construction
- 1998Sliding-window correlation for cup-and-handle construction
- 2000Constructing rectangles for breakout hypotheses
- 2001Turning one candle into a ranked numeric object
- 2002Fuzzy-scored chart patterns as testable rules
- 2002From hot-zones to an open-close-matrix
- 2003Volume pressure and a band-clearing breakout case
- 2004Evaluating chart patterns against price objectives
- 2004Cobweb turning points from price structure
- 2005Hybrid decision trees and pattern recognition for trend rules
- 2005Two-bar zone codes for testable pattern systems
- 2005Price bar pattern construction and next-bar frequency
- 2008Observe markets before following pattern or system rules
- 2012Treat a four-leg Fibonacci completion as an unpaid hypothesis
- 2014Hidden three-channel regression signals for stock and call option entries
- 2014A shared daily-chart-level framework for session trades and swing holds
- 2015Condensed candlestick signatures