2014issue C0636-44
A shared daily-chart-level framework for session trades and swing holds
The same reverse-countertrend construction can govern a same-day exit and an overnight hold when daily-candlestick levels remain the only valid triggers. Overnight permission, an intraday-block, and a swing-hold-rule change exposure without rewriting the pattern.
- A daily-chart-level taken from the daily candlestick chart is the only valid trigger for both session trades and overnight holds.
- The swing-hold-rule is overnight permission on those same levels, not a second stock list and not a different strategy.
- Session construction uses a fixed 100-, 200-, or at most 300-share intraday-block, and new traders stay session-only until daily and premarket-level reading is learned.
- Potential, pending, and confirmed pattern-stage labels, with a retracement-tolerance around ratio tests, sit beside the same daily construction.
The same rules for two holding styles
This construction uses the same reverse-countertrend pattern for session trades and overnight holds. The trade is short after a break through resistance and long after support.
A daily-chart-level is a support or resistance zone taken from the daily candlestick chart. Those daily-candlestick levels are the only valid triggers. The stock list and the pattern rules stay the same when a trade is held past the close.
The swing-hold-rule
A swing-hold-rule is the overnight-permission test that turns an already valid daily-chart-level into a multi-session position instead of a same-day exit.
A swing-level test can require the level to hold for 10 days and then move a full dollar beyond it before that daily zone is treated as a swing setup rather than a session-only level.
The intraday-block and the learning path
Session trades are constructed in a fixed intraday-block of 100, 200, or at most 300 shares. Overnight size is allowed to vary with available capital.
New traders are instructed to start with session-only construction because losing trades can be closed the same day. Overnight exposure waits until the daily-chart-level and the premarket-level are learned. A premarket-level is an equity reference formed before the regular session, and it must be readable before a daily-level trade is held overnight.
Targets, liquidity, and the series-of-levels
The session profit target in this construction was reduced from 25 cents to 15 cents after 2009 because high-frequency activity made the wider target harder to capture consistently on 100-share blocks.
Stocks priced over $100 a share are selected for this construction because higher liquidity is described as producing more consistent pivot points of the kind high-frequency algorithms also use.
A series-of-levels is an ordered stack of daily supports and resistances. A level that works in one trader’s series of daily supports does not automatically transfer. Insufficient capital to capture a later support in the same series means the entry was taken at the wrong rung, and that wrong rung invalidates the trade even if a later rung later works.
Pattern-stage labels on the same chart
Pattern-recognition software can report bars back to the most recently confirmed pattern and a remaining-bar count until anticipated completion. Zero remaining bars marks a pending pattern whose ratio and time tests are already met.
Chart patterns pass through potential, pending, and confirmed stages. Each of those states is a pattern-stage used to decide whether a ratio-and-time setup is still forming or already complete. Setting a retracement-tolerance around a Fibonacci retracement ratio, so the geometric test has an allowable distance, is presented as part of a usable harmonic-pattern construction workflow.
ES daily: June 2012 valley and the rally that followed
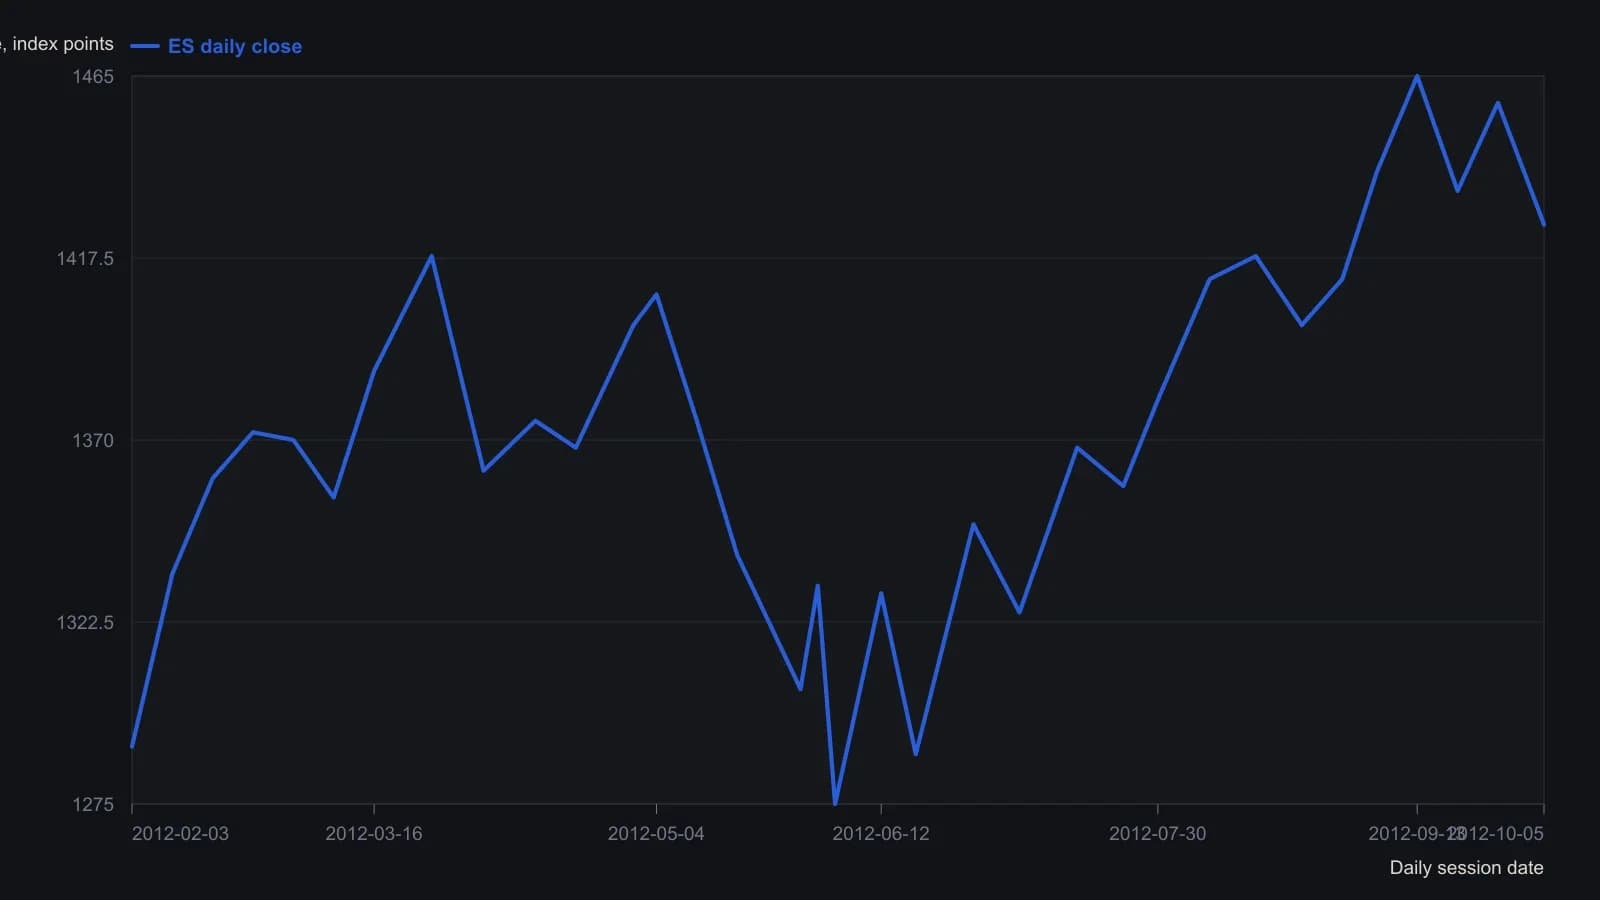
Except for those two readouts, prices are digitized to the nearest five index points from the daily bars. The platform header marks the feed as delayed by 10 minutes and does not name a contract month.
All readings on this track · 25 readings
- 1986Construct a decision procedure that revises itself
- 1989Finish the volume checklist before scoring the breakout
- 1989Constructing supervised forecasts on moving averages
- 1991Candlestick labels as stacked construction tests
- 1992Walk-forward evaluation of weekly price-change patterns
- 1993RSI price pattern templates and open interest
- 1994Constructing a dual-net day-ahead index direction forecast
- 1994A clocked stochastic second crest with a window-high stop
- 1996Volatility-ratio, inside-day and narrow-range-4 entry construction
- 1998Sliding-window correlation for cup-and-handle construction
- 2000Constructing rectangles for breakout hypotheses
- 2001Turning one candle into a ranked numeric object
- 2002Fuzzy-scored chart patterns as testable rules
- 2002From hot-zones to an open-close-matrix
- 2003Volume pressure and a band-clearing breakout case
- 2004Evaluating chart patterns against price objectives
- 2004Cobweb turning points from price structure
- 2005Hybrid decision trees and pattern recognition for trend rules
- 2005Two-bar zone codes for testable pattern systems
- 2005Price bar pattern construction and next-bar frequency
- 2008Observe markets before following pattern or system rules
- 2012Treat a four-leg Fibonacci completion as an unpaid hypothesis
- 2014Hidden three-channel regression signals for stock and call option entries
- 2014A shared daily-chart-level framework for session trades and swing holds
- 2015Condensed candlestick signatures