2018issue C0630-35
Constructing an adaptive filter for adoption-cycle reversals
The constructed filter joins an adaptive moving average, an adoption-of-price histogram, and a supply-demand state in one visual output. Editorial reading: students can use that single readout to test when participation is still rising even as new buyers start to fade.
- Assemble the adaptive moving average, the adoption-of-market-price histogram, and the supply-demand state as one visual output rather than three separate readouts.
- Map buyer and seller arrival onto a bell-shaped path so new participation can be located as increasing, saturating, or already fading.
- Treat a decline in new adopters as a leading participation change and a mean-reversion setup, not as proof that total participation or price has already peaked.
- Complete the trend-filter state only when filter distance, participation pace, and the shift from demand-side to supply-side control agree.
One shared visual output
The constructed filter is assembled so an adaptive moving average, an adoption-of-price histogram, and a supply-demand state share one visual output rather than three separate readouts.
The adaptive moving average is a responsive, smoothed price filter that updates with current observations and serves as the baseline from which diversions and reversions are measured.
Mapping arrival on the adoption path
The adoption-of-market-price construction maps buyer and seller arrival onto a bell-shaped path so a trader can locate where new participation is still increasing, saturating, or already fading. Adoption-of-market-price is a market analogue of an innovation-adoption curve in which new buyers or sellers arrive, saturate, and then thin while total participation can still rise.
A decline in new adopters is specified as a leading participation change, not as immediate proof that total participation or price has already peaked.
The early-warning histogram is the constructed series that maps participation arrival and fade as a bell-shaped path around the adaptive filter so a shift from demand toward supply can be seen before price fully turns.
Measuring diversion from the adaptive filter
The same decline is treated as a mean-reversion setup: fewer participants willing to buy at the prevailing price is aligned with a later reversion toward the adaptive filter within a defined number of bars. Mean reversion is the tendency of price to return toward the adaptive filter after a moderate-to-strong diversion, treated as a testable turning-point process rather than a forecast of the next print.
The adaptive filter is the baseline for measuring how far price has diverted and how it later reverts. Those irregular swings, not a perfect parabola, are what the histogram is built to display.
In moderate-to-strong diversions away from the adaptive filter, a bell-shaped histogram is expected to become distinguishable even when the live path is chaotic and does not match an idealized curve.
When the trend-filter state is complete
When new demand fades while offers continue to arrive, the construction flags a supply-over-demand lag that can precede a downward turn. The opposite fade in sellers is used to flag upward pressure.
The trend-filter state is complete only when three constructed readings agree: strength of diversion and reversion from the adaptive filter, the pace of new participation on the adoption path, and the shift from demand-side to supply-side control as that path declines.
A trend-filter is a visual state of supply versus demand that advances or withholds a directional read when the adoption histogram, filter distance, and participation path agree.
AAPL price against the triple-passband Laguerre filter
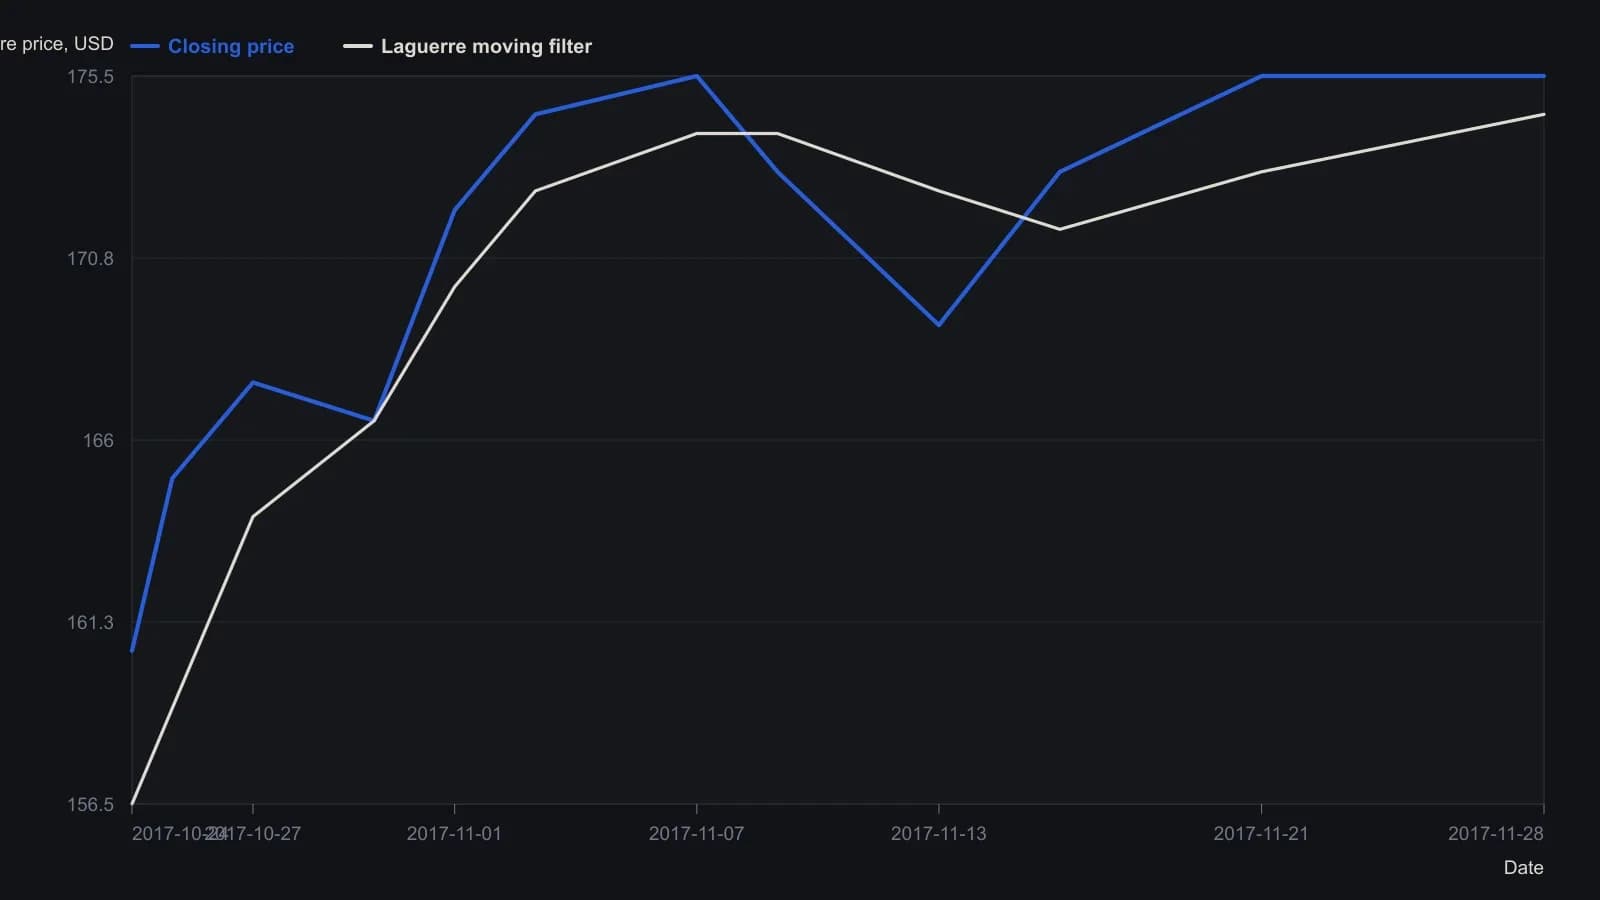
The Early Warning histogram was not digitized because its vertical scale is overprinted and not uniquely labeled. Session dates follow the published window sampled along the raster; they are not a tick-by-tick extract.
All readings on this track · 24 readings
- 1991Building variable-length moving averages from partitioned price changes
- 1991Variable-length moving average from change dispersion
- 1992Constructing volatility-adaptive exponential smoothing
- 1995Constructing an adaptive moving average with an efficiency ratio and filter
- 1995Two-gate breakout confirmation with adaptive averages
- 1995Building momentum-scaled adaptive moving averages
- 1995Adaptive length as a construction choice inside exponential smoothing
- 1998Testing price-channel breakouts with a lag-aware adaptive average
- 1998Constructing filters by nesting offsets and variable weights
- 1998Constructing an efficiency ratio adaptive average and entry filter
- 2001Encoding candle structure as a numeric filter
- 2001Adaptive averages driven by cycle-phase speed
- 2005Constructing an adaptive moving average from a fractal-dimension weight
- 2005Range-dimension adaptive exponential filter
- 2010Constructing simple, exponential, and adaptive averages
- 2010How a price-hugging smoother is assembled from ordinary averages
- 2013Evaluating an adaptive moving average against a same-window moving average
- 2016Three-layer confirmation: adaptive average, stochastic relative strength index, and stop-and-reverse
- 2017One-alpha reverse-path exponential smoothing
- 2018Pair two adaptive averages to filter swing turns
- 2018Two Adaptive moving averages as a confirmation pair
- 2018Constructing an adaptive filter for adoption-cycle reversals
- 2018Constructing a deviation-scaled adaptive moving average
- 2020Walk-forward and adaptive averages as two tests of the same trend