1989issue C101-5
Cluster-first construction of change-in-trend days from two ratio families
Measure one high-to-low trading-day span, project it through a fibonacci-time-cycle family and a time-price-square family, and keep only the overlapping ratio-clusters as candidate change-in-trend days. Each surviving date is then read as a reversal hypothesis or an acceleration hypothesis.
- The trading-day span between the last intermediate high and low is the only count later scaled by both ratio families.
- A fibonacci-time-cycle date and a time-price-square date become a candidate change-in-trend-day only where they form a ratio-cluster, especially around the paired factors 0.5625 and 0.55, 0.9 and 0.892, and 1.0 and 1.0125.
- Each clustered date is hypothesized as either a reversal or an acceleration, using volume, open interest, momentum, and nearby support or resistance rather than a fixed price reaction.
- The working window is the projected day plus or minus one day, and the same construction is presented for stock indices and commodities.
Measure one high-to-low span
The construction begins by marking the last intermediate high and low on the chosen timeframe. The trading-day span between those two dates is the time range used for all later projections.
That single count is then scaled in two ways. A fibonacci-time-cycle family uses the golden-section-ratios. A companion time-price-square family uses square-of-the-range fractions taken from gann-angles construction. Both products are added to the same swing low so the two calendars can be compared.
Build the two date families
A fibonacci-time-cycle family is built by multiplying the measured span by the golden-section-ratios 1.0, 0.892, 0.618, 0.55, and 0.382, then adding each product in trading days to the low to obtain candidate calendar dates.
The second family, the Square of the Range, is the time-price-square grid. It multiplies the same span by 0.1125, 0.225, 0.3375, 0.45, 0.5625, 0.675, 0.7875, 0.9, and 1.0125. Those factors are described as multiples of 100 times 360/32, the 360-degree, 32-part gann-angles division that supplies the increments. Each product is again added to the low.
Keep only the overlapping neighborhoods
Because both families scale one shared span, projected dates cluster around the paired factors 0.5625 with 0.55, 0.9 with 0.892, and 1.0 with 1.0125. Those ratio-clusters are the candidate change-in-trend days.
The same two-family construction is presented as applicable to both stock indices and commodities. The working window is specified as the projected day plus or minus one day.
July soybean illustration
In the July soybean illustration, a June 23, 1988 peak was followed by a low 105 market days later. The two-family clusters fell on September 14-15, 1988 and on November 14, 23, and 24, 1988.
Daily soybeans from the mid-1988 high into January 1989
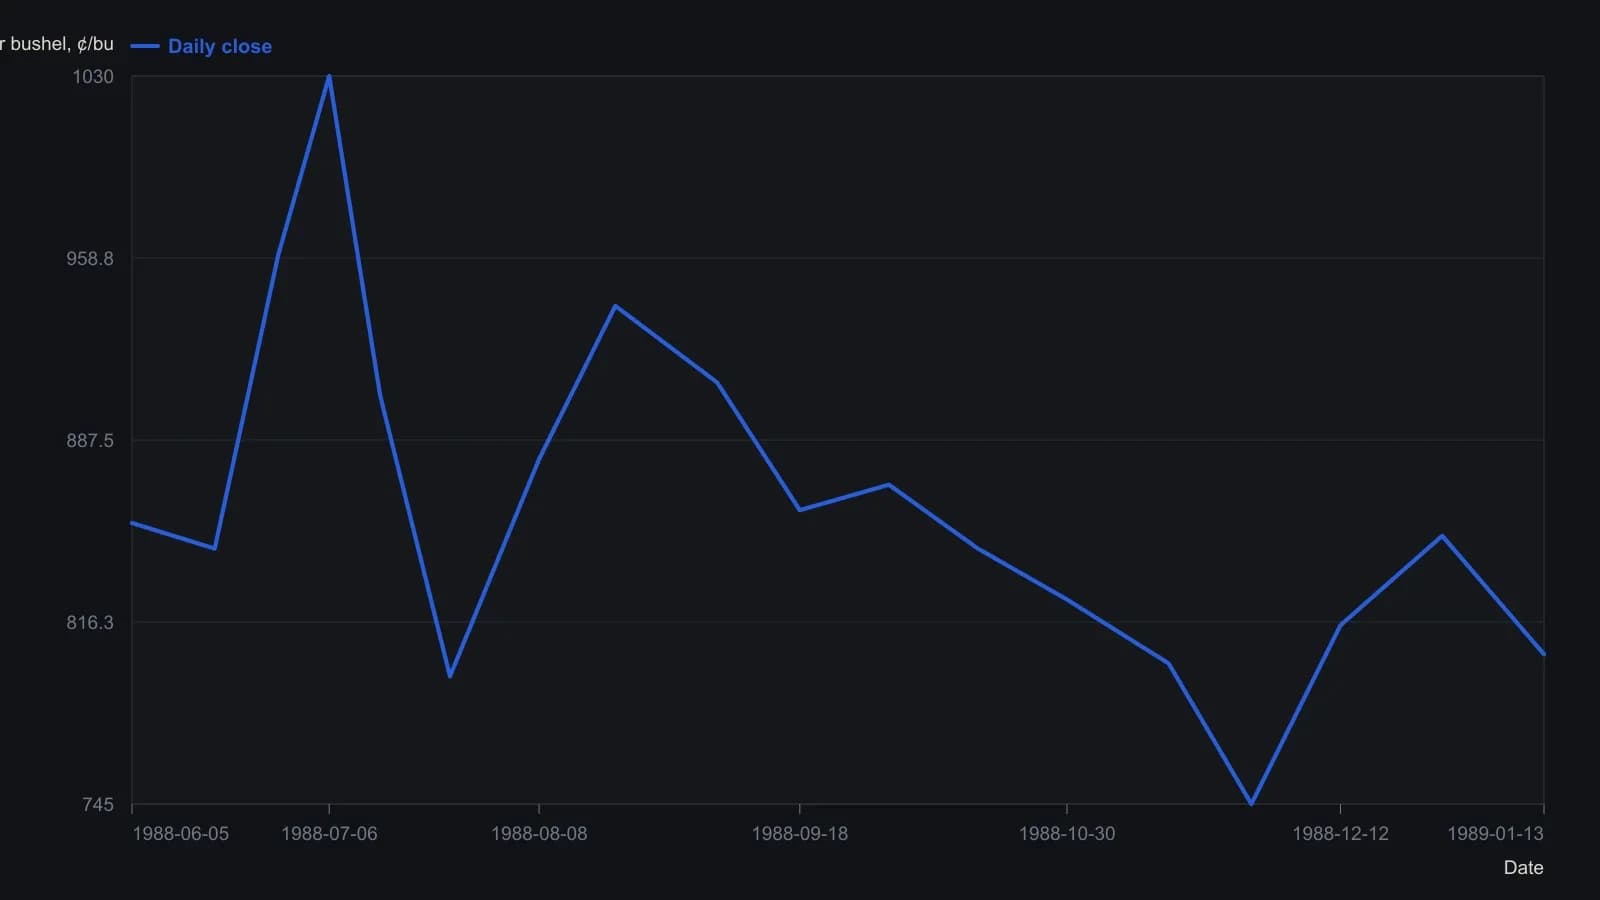
Except for the final printed session, points are visual readings from a coarse daily-bar raster and are rounded to the nearest five cents.
Split each date into reversal or acceleration
On a clustered change-in-trend-day the model anticipates either a distinct directional reversal or a distinct acceleration of the prevailing trend, not a single fixed price reaction.
A reversal-style reading is associated with declining volume and open interest into the date, extreme momentum, and price near defined support or resistance. An acceleration-style reading is associated with expanding volume and open interest, a confirmed signal, and a chart breakout.
Optional confirmation overlays named in the construction include oscillator-style studies and auction-profile data. They are used to check that price sits at a momentum extreme and a chart barrier on the projected date.
Editorial note: those overlays classify a date that has already survived as a ratio-cluster. They do not turn a lone Golden Section or Square of the Range print into a setup.
All readings on this track · 12 readings
- 1988Four sugar-futures turns as a ranked wave-ratio audit
- 1989Cluster-first construction of change-in-trend days from two ratio families
- 1992Wheat bull leg from a squared counterswing and Gann angles
- 1999Log-spiral wave construction from seed pivots
- 1999Compound pivots and market symmetry
- 1999Squaring charts for Gann angles
- 2007Constructing Gann time-price squares, angles, and 144 grids
- 2010Constructing Gann angles to square price and time
- 2011How a Lucas time series is built onto an Elliott wave map
- 2013Time-price boxes for wave-four construction
- 2016Gann circle eighths, Fibonacci neighbors, and time-price squares
- 2016Constructing wave cycles, Fibonacci spans, and time-price squares