1995issue C061-9
Weekly long-only trend rules with a gated retracement exit
A weekly long-only trend-following procedure stays invested only in authoritative rising action. Entry is a five-bar high accepted only when the five-bar low sits above the thirteen-bar low. Exit is a tight percentage retracement that a moving-average intensity filter can turn off while the climb stays steep.
- Trend-following on weekly bars is specified as a long-only procedure that stays in the market during authoritative rising action and stands aside in cash during unsure sideways or falling action.
- The entry-pattern accepts a five-bar high only when that window's lowest low is also above the thirteen-bar lowest low, so range signals and falling markets are less likely to trigger.
- The retracement-exit is a percentage drop from the thirteen-bar highest low, scaled by the latest low; a trend-filter turns that tight exit off when the five-bar range of a 26-bar moving average is above 1.2.
- Three entry settings were held at midpoints from other procedures, while only the two exit settings were varied on a five-by-five grid of twenty-five historical trials.
A long-only weekly stance
The procedure is specified as long-only trend-following on weekly bars. It stays in the market during authoritative rising action and stands aside in cash during unsure sideways or falling action.
Entry and exit are specified as different devices. The entry is a selective breakout meant to catch only strong advances. The exit is adaptive: it is meant to let strong advances run while closing the position in uncertain conditions.
S&P 500 weekly closes, April 1982 to November 1991
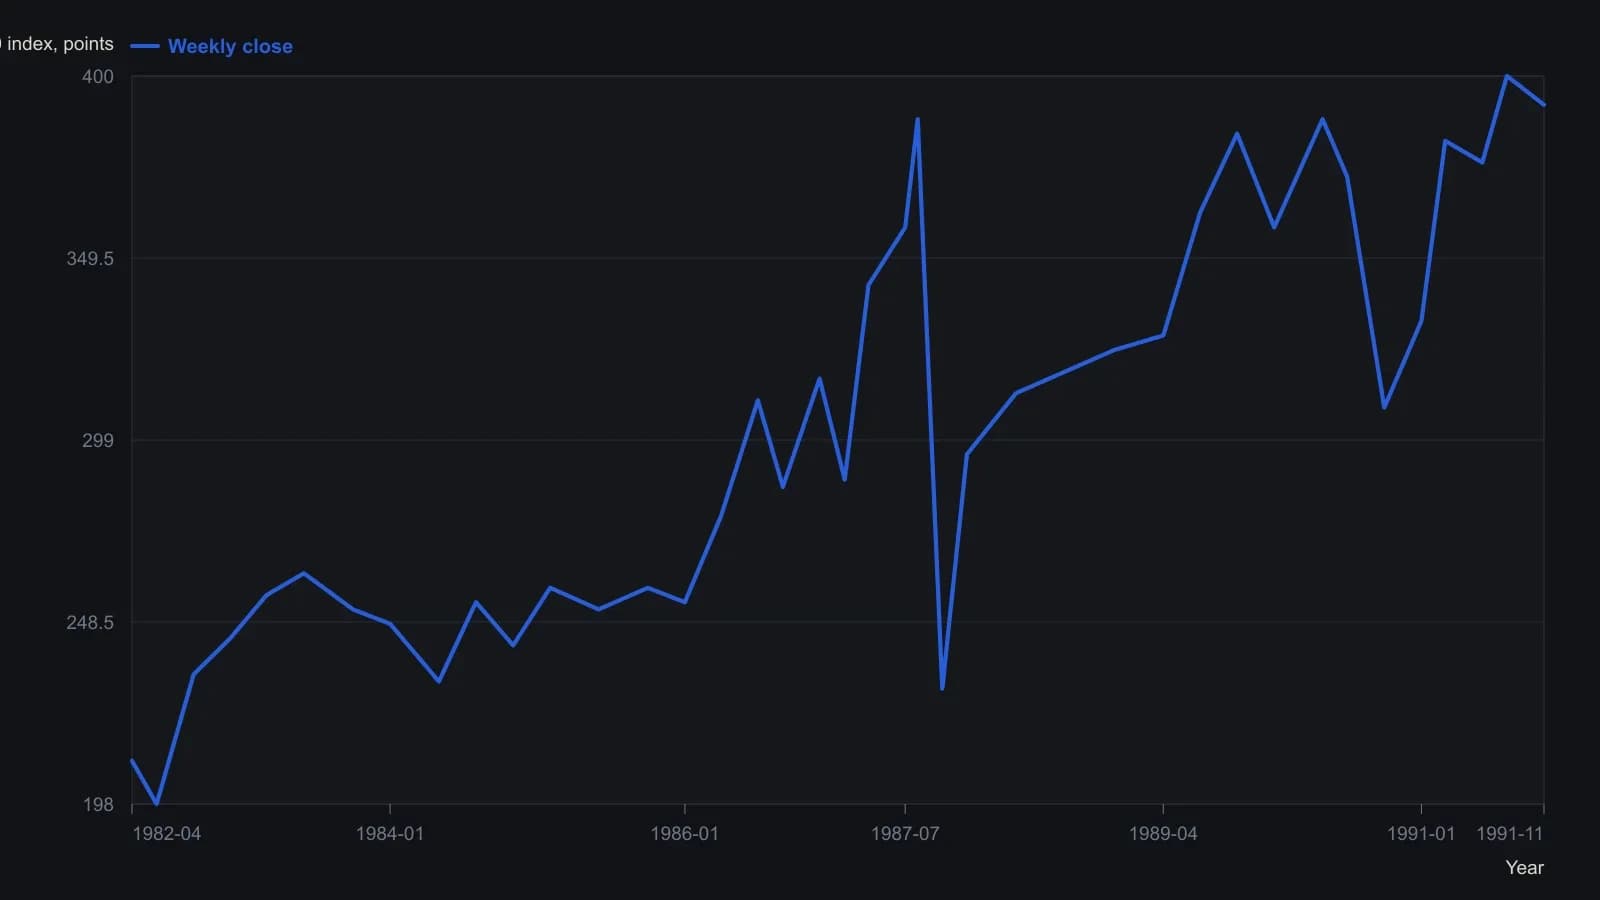
Visually digitized from the weekly close line on the printed chart; readings are approximate to a few index points. The source omitted interest and commissions and filled signals on the next bar’s open.
The entry-pattern
A new high of a short lookback is accepted only when that window's lowest low is also above the lowest low of a longer lookback. The longer window is larger than the shorter one, in order to reduce range signals and suppress signals in falling markets.
Those two lookbacks are set at five weekly bars and thirteen weekly bars. The written entry-pattern is a latest weekly bar that is the five-bar high, accepted only when the five-bar low is above the thirteen-bar low.
A comparable retracement exit
The retracement-exit measures the gap between the latest low and the highest low of the last thirteen bars, then divides that gap by the latest low. The retracement can then be stated as a percentage that is comparable across price levels.
When the trend-filter silences the exit
Trend intensity is measured as the range of the last five values of a 26-bar moving average. Dividing that range by the last close and multiplying by 100 makes the same filter comparable across markets. That longer-period average of weekly prices is the moving-average used here.
A tight retracement exit is left on when that intensity measure is below 1.2 and turned off when the measure is above 1.2, so brief pullbacks during a strong climb are less likely to close the position. That on-or-off threshold is the trend-filter.
The written rule set
The written rule set is: enter long when the latest weekly bar is the five-bar high and the five-bar low is above the thirteen-bar low; exit when the latest low is more than one half of 1 percent below the thirteen-bar highest low and the five-bar range of a 26-bar moving average is below 1.2.
How the settings were varied
Three entry settings were chosen as midpoints from other procedures, while only the two exit settings were varied on a five-by-five grid, producing twenty-five trials.
The historical check used 500 weekly bars from April 1982 through November 1991, took fills on the next bar's open, and omitted interest and commission to simplify the procedure.
All readings on this track · 38 readings
- 1986A Marshall Wave book is assembled one confirmed stance at a time
- 1987Operator gut check when two systems conflict
- 1988Visual trend rules need one testable procedure
- 1988Audit trend and breakout rules sold without tests
- 1992Weekly 4 percent close reversal case study
- 1992Write down the plan, then wait for the cross
- 1994Constructing a three-rule moving-average system
- 1995Weekly long-only trend rules with a gated retracement exit
- 1997Constructing rainbow charts with repeated smoothing
- 1997Three-line break as a one-parameter mechanical filter
- 2000Nested horizon trend alignment with a momentum stack
- 2001When certainty turns off the stop
- 2001Price must confirm every setup
- 2001Constructing a color stack from every lookback
- 2002Evaluating mechanical trend signals from ten-session average excursions
- 2004Trend pullbacks with a fifty-day average and relative strength index
- 2005Stochastic overbought as a trend-regime state
- 2005Trend-following as one testable signal procedure
- 2007One checklist for entry, exit and abstention after a market switch
- 2008Parallel listings and divergent trend behavior
- 2008Recovery headlines versus trend-regime rules
- 2008Constructing an intraday trend procedure with confirming close, retest, and planned exits
- 2010Mechanical trend-following system design, stops, and validation
- 2010A trading-plan that sets entry, stop, trail, and pause together
- 2010Multi-horizon cycle signals, trend filters, and stops
- 2012Weekly bear-market and shock signals as a mechanical procedure
- 2013A 2013 rates week as a structure-first exit drill
- 2013Trend following as one testable procedure
- 2013A forex veto checklist: trend, pair economy, and crowd bias
- 2015Relative-strength-index rules under a 20-percent trend filter
- 2015Trend-gated oscillator entry and exit rules
- 2016Trend process versus end-goal trading
- 2017Gold as a classroom for one midterm-trend procedure
- 2017Falling-knife FX longs wait for a four-hour trend turn
- 2018A closed procedure for quarterly sector rank slots
- 2018A recursive median as shared state for trend rules
- 2020Moving-average construction as an objective trend filter
- 2020Constructing first and second cross trend entries