1997issue C101-7
Three-line break as a one-parameter mechanical filter
Lock how a three-line break chart defines mode and reversals, then grade confirmation and market-screening rules by sequence quality and time out of the market before any mode change is allowed to become an entry or exit.
- A three-line break chart adds a line only when the period close clears a channel set by recent lines, so prices that stay inside that channel never become new lines.
- The only first-pass parameter is the reversal line count. Trending mode is a chosen run of same-direction lines, and a reverse line is drawn only when the close exceeds that run.
- The elementary mechanical reading enters when upward trending mode first appears, liquidates or reverses when mode reverses, and stands aside while direction is mixed.
- A confirmation line, either a second same-direction line or a higher reversal count, is graded by sequence quality and by how much time the rules keep the position out of the market.
Fewer lines than periods
A three-line break chart adds a line only when that period’s move meets a mode-dependent test. Prices that stay inside the recent-line channel are omitted, so the chart has fewer lines than periods. In typical examples, about two-thirds of high-low-close bars collapse to one line.
After a first-period basis line, each later line runs from the prior line’s price to the current close. Three same-direction lines define trending mode, and a reverse line is drawn only when the close exceeds the high or low of those three lines.
The construction uses a single price per period, so the same rules can be applied to series that lack high-low-close or intradaily data.
One reversal count sets the mode
The only first-pass parameter is the reversal line count, commonly three. That count is simpler to set than a point-and-figure box size. Three-line and four-line versions of the same yen series stay identical over large segments, so the trend reading often does not change with the count.
Citicorp three-line break, May through August
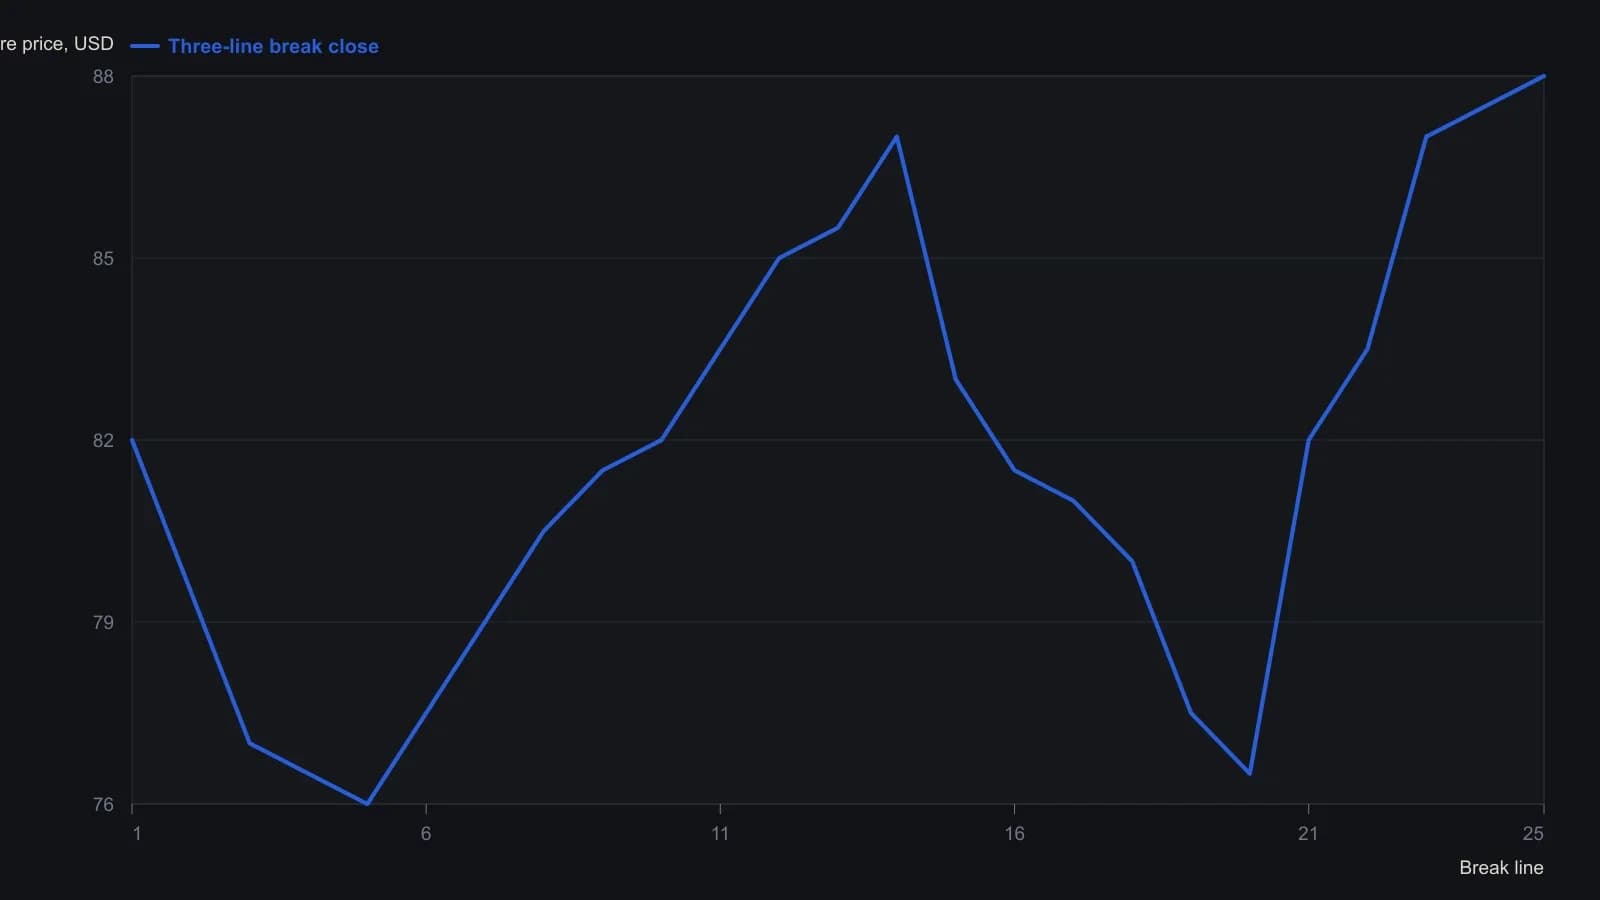
Line-end prices were read from the raster to the nearest half point. The x-axis is break-line order, not calendar time; the source notes that break charts use a nonlinear time axis.
Entry, exit, and abstention from mode
A mechanical trading system is a complete mapping from observed market state into entry, exit, and abstention without a discretionary override. Trend following participates only while a defined trend state is in force and liquidates, reverses, or stands aside when that state fails.
The elementary mechanical reading is to enter when upward trending mode first appears, liquidate or reverse when mode reverses, and stand aside while direction is mixed.
Sequence quality on the historical examples
On the cash-index example, 34 signals appeared and 28 were runs of at least three same-direction lines. Isolated one- or two-line interruptions were treated as false steps that the rules would unwind on the next valid line.
Five continuously linked futures series from 1992 through 1996 produced 160 apparent reversals, of which 40 were not three-or-more-line sequences. On the three-line yen chart, eight of 28 signals reversed after only a short contrary run.
Confirmation lines and market screens
Two evaluation adjustments were compared: wait for a second same-direction confirmation line, or raise the reversal hurdle to four lines. The four-line yen chart counted 20 of 26 signals as accurate over five years, at the cost of later participation.
A market was treated as poorly matched when successive signals failed to capture the move or reversed too often. Among a few dozen futures series, lumber, coffee, and Nikkei were judged to give the most usable signals, while the charts were used as trend confirmation on nearly every series examined.
Time out of the market
The historical comparison omitted transaction charges and treated reduced time in the market as part of the evaluation. It reported long-side exposure of 50.7 percent over 430 days for lumber from July 1993 to December 1996 and 45.0 percent over 337 days for Nikkei from January 1992 to January 1994.
All readings on this track · 38 readings
- 1986A Marshall Wave book is assembled one confirmed stance at a time
- 1987Operator gut check when two systems conflict
- 1988Visual trend rules need one testable procedure
- 1988Audit trend and breakout rules sold without tests
- 1992Weekly 4 percent close reversal case study
- 1992Write down the plan, then wait for the cross
- 1994Constructing a three-rule moving-average system
- 1995Weekly long-only trend rules with a gated retracement exit
- 1997Constructing rainbow charts with repeated smoothing
- 1997Three-line break as a one-parameter mechanical filter
- 2000Nested horizon trend alignment with a momentum stack
- 2001When certainty turns off the stop
- 2001Price must confirm every setup
- 2001Constructing a color stack from every lookback
- 2002Evaluating mechanical trend signals from ten-session average excursions
- 2004Trend pullbacks with a fifty-day average and relative strength index
- 2005Stochastic overbought as a trend-regime state
- 2005Trend-following as one testable signal procedure
- 2007One checklist for entry, exit and abstention after a market switch
- 2008Parallel listings and divergent trend behavior
- 2008Recovery headlines versus trend-regime rules
- 2008Constructing an intraday trend procedure with confirming close, retest, and planned exits
- 2010Mechanical trend-following system design, stops, and validation
- 2010A trading-plan that sets entry, stop, trail, and pause together
- 2010Multi-horizon cycle signals, trend filters, and stops
- 2012Weekly bear-market and shock signals as a mechanical procedure
- 2013A 2013 rates week as a structure-first exit drill
- 2013Trend following as one testable procedure
- 2013A forex veto checklist: trend, pair economy, and crowd bias
- 2015Relative-strength-index rules under a 20-percent trend filter
- 2015Trend-gated oscillator entry and exit rules
- 2016Trend process versus end-goal trading
- 2017Gold as a classroom for one midterm-trend procedure
- 2017Falling-knife FX longs wait for a four-hour trend turn
- 2018A closed procedure for quarterly sector rank slots
- 2018A recursive median as shared state for trend rules
- 2020Moving-average construction as an objective trend filter
- 2020Constructing first and second cross trend entries