2004issue C031-4
Trend pullbacks with a fifty-day average and relative strength index
The historical workflow waits for a pullback to the fifty-day average inside already aligned monthly and weekly uptrends, then asks two relative strength index lookbacks and a confirming reversal whether the short retreat is still a continuation setup. The first close back through that same average ends the hold.
- Three horizons are treated as simultaneous: a long-term backdrop lasting months or years, an intermediate swing lasting weeks or months, and short-term corrections of that swing.
- The fifty-day average is the intermediate-trend line, used as the pullback entry zone and the first-close exit, while the 200-day average, treated as the daily counterpart of a 40-week weekly average, is the long-horizon line.
- A 14-day relative strength index times the end of short retreats at readings below 30; a 21-day reading is taken at the RSI fifty line, where a hold above 50 keeps the dip classified as continuation.
- Monthly and weekly uptrends are required before a daily setup near the fifty-day average is used, and standing aside is a valid output when those frames do not align.
Three horizons at once
Three trend horizons are treated as simultaneous: a long-term backdrop lasting months or years, an intermediate swing lasting weeks or months, and short-term corrections of that intermediate swing.
A moving average is a smoothed price line whose length is matched to a chosen horizon and then used as both a trend filter and a pullback or exit reference. A 40-week average on a weekly chart is presented as the same long-horizon line as a 200-day average on a daily chart, using five trading days times 40 weeks, and that line is used to judge the broader bullish or bearish backdrop.
The 50-day average is the intermediate-trend line. In a strong advance, prices generally stay above it and often tag it on the first pullback after a breakout, with two or more closes still above it treated as a strength reading.
Short retreats to the working average
Trend-following stays with the prevailing direction, takes pullbacks inside that direction, and treats a close through the working average as the end of the holding period. Once a trend is established, three-to-five-day declines that touch the working average are described as common, and five-to-ten-day declines as less common. Lighter down-volume than the prior advance is treated as a healthier pullback.
Starting far above the 50-day average is treated as riskier than waiting for a later tag of that average, because price is described as eventually returning to its averages and a distant breakout can sit above a later pullback.
Two relative strength index lookbacks
A relative strength index is an oscillator on ordered prices that can time oversold reversals on a shorter lookback and mark trend regime at the 50 line on a longer lookback.
A 14-day relative strength index is used to time the end of those short retreats. Overbought readings during an uptrend are treated as unreliable, while reversal work is focused on readings below 30.
A 21-day relative strength index is read at the RSI fifty line rather than as an overbought or oversold oscillator. Above 50 is bullish, below 50 is bearish, and a cross of 50 is the buy or sell flip that, with the 50-day average, defines the combination signals.
Hot Topic daily price against the 50-day and 200-day exponential averages, March–October 2003
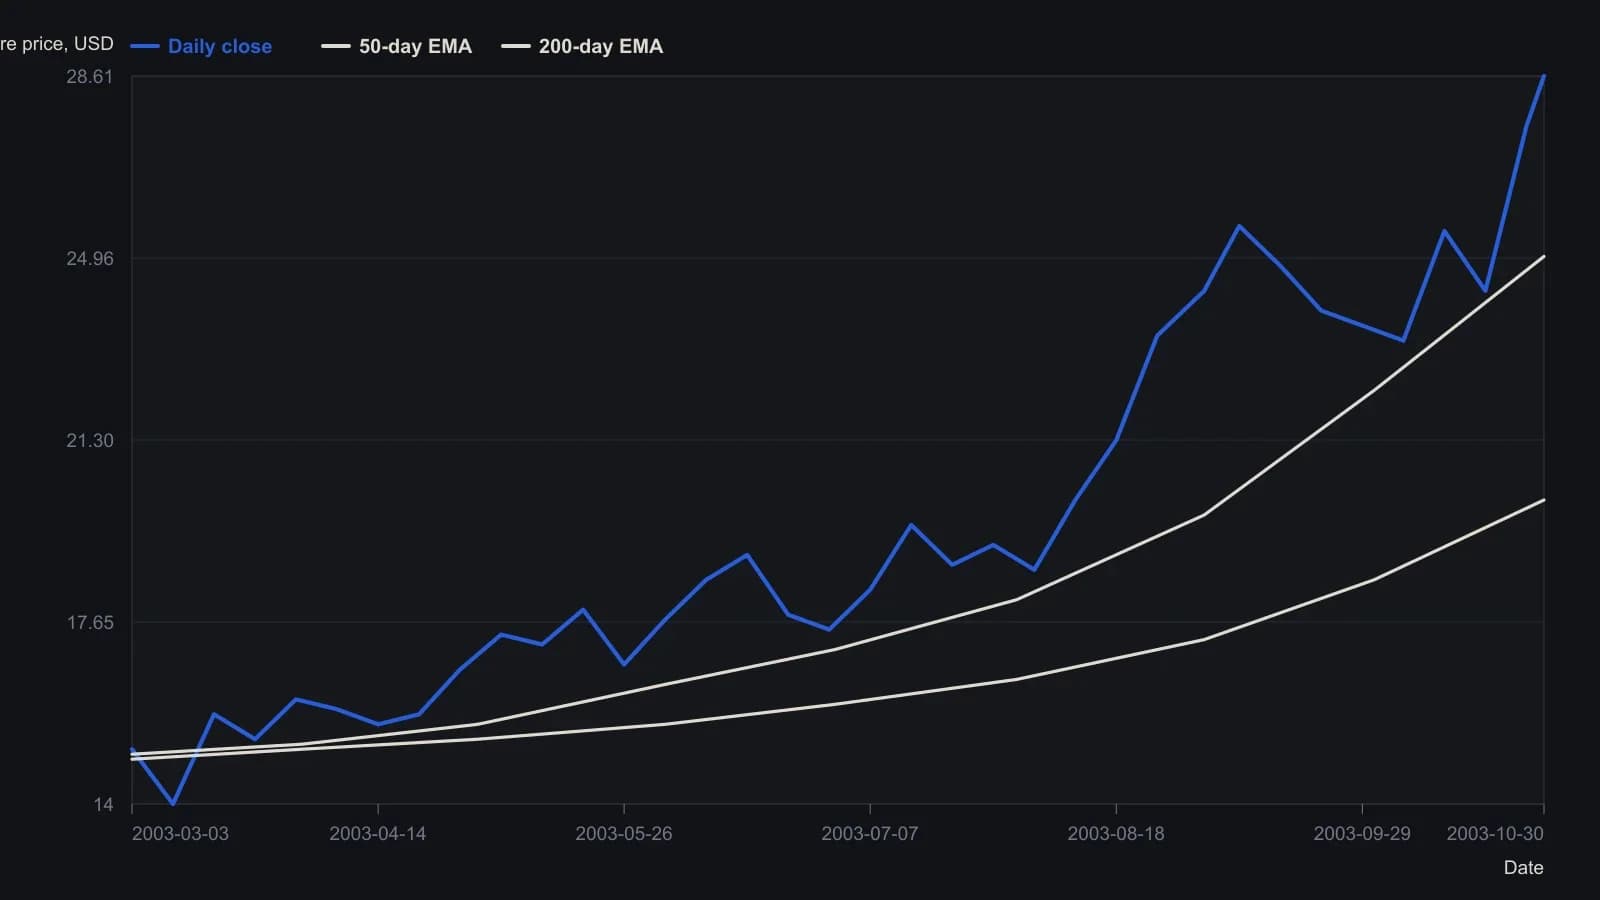
The magazine figure plots EMA(50) and EMA(200) even though the prose only says moving average. Intermediate closes are raster readings at roughly weekly spacing, not a tabulated series.
The entry stack
The stated entry stack is an uptrend pullback to the 50-day average, a 14-day relative strength index that is oversold and turning, a 21-day reading still above 50, and a confirming upward price reversal. An initial stop is placed 0.25 below the reversal low, and the exit is the first close below that same 50-day average.
Monthly and weekly uptrends are required before a daily setup near the 50-day average is used. When those frames do not align, standing aside is treated as a valid output of the trend-following procedure.
The same average for the exit
The exit stays on the same average used for entry, so a 20-day entry is not held down to the 50-day line. Price must confirm with a three-bar reversal, a pattern whose middle bar is flanked by higher lows, with action delayed until the next session exceeds that middle-bar high.
A 10 percent open gain then hands the stop to the 50-day average. A close below that average still ends the hold even if a bounce is expected. A later close back above the average plus a relative-strength turn is allowed to restart the same rules.
All readings on this track · 38 readings
- 1986A Marshall Wave book is assembled one confirmed stance at a time
- 1987Operator gut check when two systems conflict
- 1988Visual trend rules need one testable procedure
- 1988Audit trend and breakout rules sold without tests
- 1992Weekly 4 percent close reversal case study
- 1992Write down the plan, then wait for the cross
- 1994Constructing a three-rule moving-average system
- 1995Weekly long-only trend rules with a gated retracement exit
- 1997Constructing rainbow charts with repeated smoothing
- 1997Three-line break as a one-parameter mechanical filter
- 2000Nested horizon trend alignment with a momentum stack
- 2001When certainty turns off the stop
- 2001Price must confirm every setup
- 2001Constructing a color stack from every lookback
- 2002Evaluating mechanical trend signals from ten-session average excursions
- 2004Trend pullbacks with a fifty-day average and relative strength index
- 2005Stochastic overbought as a trend-regime state
- 2005Trend-following as one testable signal procedure
- 2007One checklist for entry, exit and abstention after a market switch
- 2008Parallel listings and divergent trend behavior
- 2008Recovery headlines versus trend-regime rules
- 2008Constructing an intraday trend procedure with confirming close, retest, and planned exits
- 2010Mechanical trend-following system design, stops, and validation
- 2010A trading-plan that sets entry, stop, trail, and pause together
- 2010Multi-horizon cycle signals, trend filters, and stops
- 2012Weekly bear-market and shock signals as a mechanical procedure
- 2013A 2013 rates week as a structure-first exit drill
- 2013Trend following as one testable procedure
- 2013A forex veto checklist: trend, pair economy, and crowd bias
- 2015Relative-strength-index rules under a 20-percent trend filter
- 2015Trend-gated oscillator entry and exit rules
- 2016Trend process versus end-goal trading
- 2017Gold as a classroom for one midterm-trend procedure
- 2017Falling-knife FX longs wait for a four-hour trend turn
- 2018A closed procedure for quarterly sector rank slots
- 2018A recursive median as shared state for trend rules
- 2020Moving-average construction as an objective trend filter
- 2020Constructing first and second cross trend entries