2020issue C0328-31
Moving-average construction as an objective trend filter
A moving average is built from ordered prices, a chosen lookback, and a weighting rule so a trend filter can classify direction instead of treating every short-term wiggle as a signal.
- A moving average averages ordered prices over a chosen lookback so short-term fluctuations are filtered and a smoother path remains for reading underlying direction.
- A simple moving average treats each period equally, while an exponential moving average weights recent prices more heavily and responds faster at the same lookback.
- Lengthening the lookback makes the line smoother and less responsive; shortening it makes the line faster and more sensitive to changing prices.
- Price above a rising average can be read as an objective bullish classification, and price below a falling average as an objective bearish classification.
How a moving average is constructed
A moving average is constructed by averaging ordered prices over a chosen lookback so short-term fluctuations are filtered and a smoother path remains for reading underlying direction. The lookback is the sampling length used to compute the average, and it jointly sets smoothness and lag.
A trend filter then uses price relative to that constructed line, and often the slope of the line, to classify the market as trending, not trending, or no longer trending.
Weighting and lookback set speed against smoothness
A simple moving average treats each period equally, while an exponential moving average weights recent prices more heavily and therefore responds faster to new prices at the same lookback.
Lengthening the lookback makes the constructed line smoother and less responsive. Shortening it makes the line faster and more sensitive to changing prices.
A longer simple average filters more short-term noise than a short exponential average, but the delayed cross means a larger share of the initial move has already occurred before the filter flips.
Short 21-period EMA versus longer 100-period SMA on hourly WTI
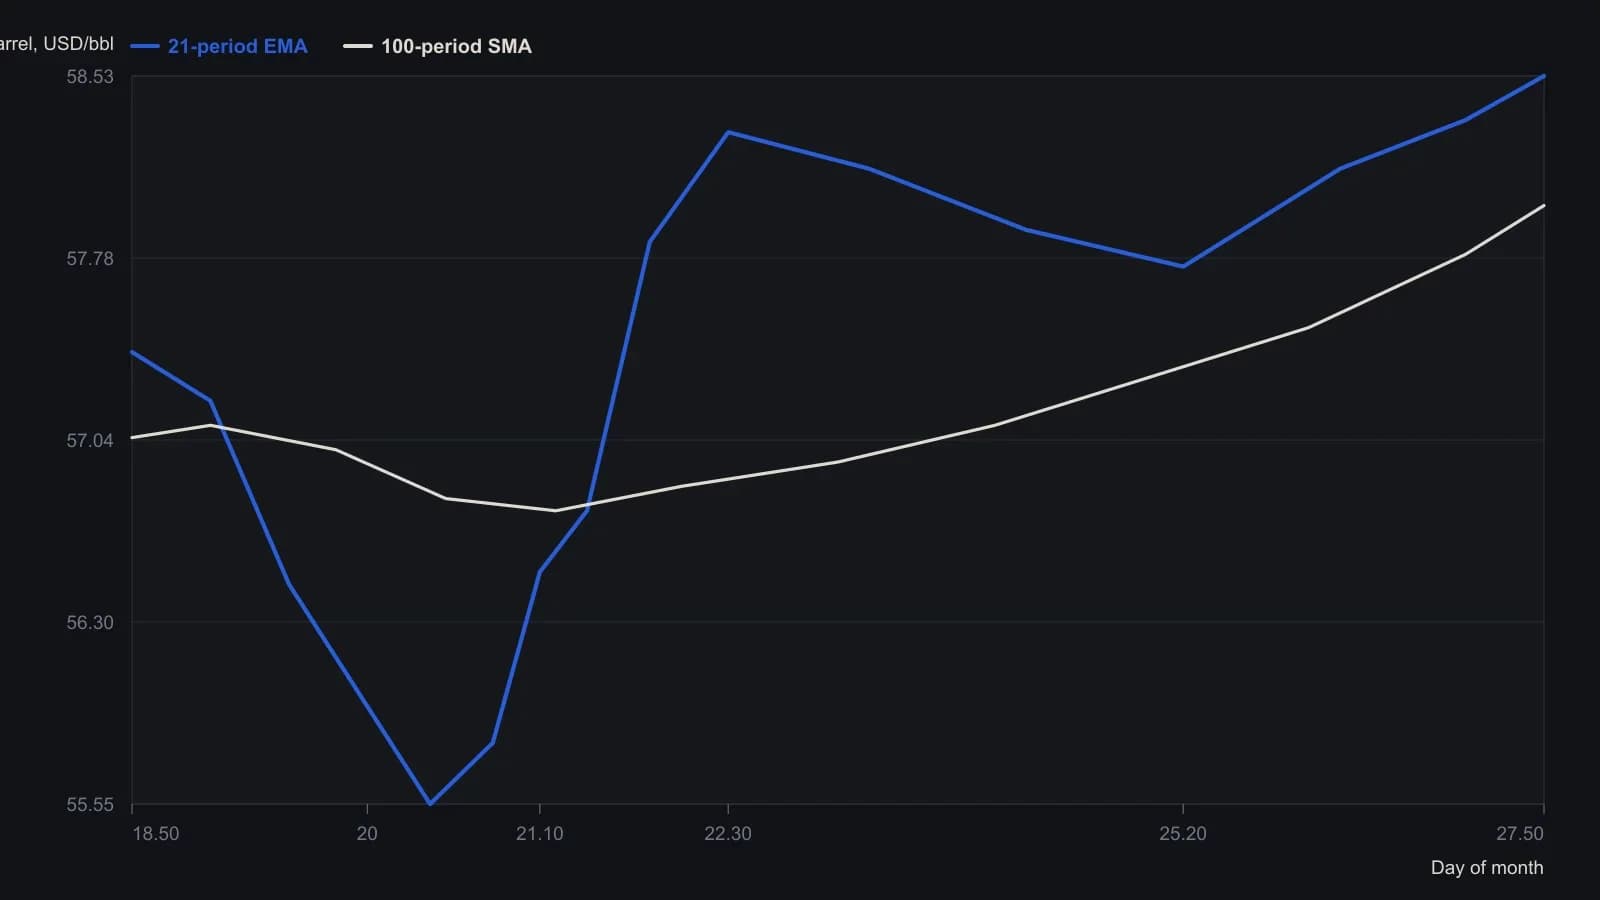
Hourly WTI crude oil. The source labels only day-of-month ticks (19–27) and does not name the calendar month. Endpoints 58.53 (21-EMA) and 58.00 (100-SMA) are the chart’s last printed readings; other points are digitized from the curves to the nearest 0.05.
Confirmation keeps a short average from firing on every cross
A short exponential average used as a buy-above or sell-below rule can produce many false crosses when price oscillates without a clear trend, and more consistent signals only after a trend is already underway.
Pairing a short-average cross with an independent confirmation, such as a pattern breakout or a later opposite-side invalidation, is one construction used to cut false trend-following signals. Confirmation is an extra condition so a short average is not traded on every cross.
Objective bullish and bearish classification
Price above a rising average can be read as an objective bullish classification, and price below a falling average as an objective bearish classification, which is the filter’s main teaching use for early trend-following. Trend-following takes entries, holds, or abstains only when the constructed filter says a trend is present, rather than fading every excursion around the average.
A 200-period daily simple average is treated as a widely shared reference, so touches, crossings, and failed breaks around that line are expected to coincide with heightened participation. That construction is long enough to act as a shared trend reference rather than a short-horizon trigger.
All readings on this track · 38 readings
- 1986A Marshall Wave book is assembled one confirmed stance at a time
- 1987Operator gut check when two systems conflict
- 1988Visual trend rules need one testable procedure
- 1988Audit trend and breakout rules sold without tests
- 1992Weekly 4 percent close reversal case study
- 1992Write down the plan, then wait for the cross
- 1994Constructing a three-rule moving-average system
- 1995Weekly long-only trend rules with a gated retracement exit
- 1997Constructing rainbow charts with repeated smoothing
- 1997Three-line break as a one-parameter mechanical filter
- 2000Nested horizon trend alignment with a momentum stack
- 2001When certainty turns off the stop
- 2001Price must confirm every setup
- 2001Constructing a color stack from every lookback
- 2002Evaluating mechanical trend signals from ten-session average excursions
- 2004Trend pullbacks with a fifty-day average and relative strength index
- 2005Stochastic overbought as a trend-regime state
- 2005Trend-following as one testable signal procedure
- 2007One checklist for entry, exit and abstention after a market switch
- 2008Parallel listings and divergent trend behavior
- 2008Recovery headlines versus trend-regime rules
- 2008Constructing an intraday trend procedure with confirming close, retest, and planned exits
- 2010Mechanical trend-following system design, stops, and validation
- 2010A trading-plan that sets entry, stop, trail, and pause together
- 2010Multi-horizon cycle signals, trend filters, and stops
- 2012Weekly bear-market and shock signals as a mechanical procedure
- 2013A 2013 rates week as a structure-first exit drill
- 2013Trend following as one testable procedure
- 2013A forex veto checklist: trend, pair economy, and crowd bias
- 2015Relative-strength-index rules under a 20-percent trend filter
- 2015Trend-gated oscillator entry and exit rules
- 2016Trend process versus end-goal trading
- 2017Gold as a classroom for one midterm-trend procedure
- 2017Falling-knife FX longs wait for a four-hour trend turn
- 2018A closed procedure for quarterly sector rank slots
- 2018A recursive median as shared state for trend rules
- 2020Moving-average construction as an objective trend filter
- 2020Constructing first and second cross trend entries