2013issue C1140-43
Trend following as one testable procedure
A 2013 systems critique said common entry tools had not been shown as a unique edge and asked whether they beat a random entry once quantified. It treated trend following as a joint procedure: simple rules, more design weight on the exit, a scan across many markets, and abstention when no one-way trend is apparent.
- Common entry tools had not been shown as a unique edge, and the critique asked whether quantified entries beat a random entry.
- Trend following was written as a joint procedure: keep the rules simple, put more design weight on the exit than the entry, and search enough markets to catch a trend wherever it appears.
- Market state dominated the result. When price is already trending, most procedures look useful. When it is not, the work is drawdown control rather than method selection.
- The checkable input was visible one-directional strength, with abstention when no one-way trend is apparent and an exit when that motion ends.
Entry tools were not shown as an edge
A 2013 systems critique stated that common entry tools had not been shown as a unique edge. The tools in view were indicators, historical price patterns, wave labels, and point-and-figure. Once those entries are quantified, the critique asked whether they beat a random entry.
After applying many named techniques, the author reported that each worked in some periods and failed in others. None reliably located huge moves before they began. None warned that a market had become untradable.
One joint procedure
The same critique treated trend following as a joint procedure rather than a search for a special entry. The design brief was to keep the rules simple, put more design weight on the exit than the entry, and search enough markets to catch a trend wherever it appears.
Market state over method selection
The dominant condition was market state. When price is already trending, most procedures look useful. When it is not, the work is drawdown control rather than method selection.
A low volatility-index reading sometimes coincided with later highs. Treating that reading as a stand-aside signal would have excluded the 1991-2000 and 2004-07 advances.
Visible one-directional strength
Two checkable observations were used to justify buying visible one-way strength. A 50% move has not occurred without a prior 10% move. The largest moves tend to remain one-directional. In this procedure, one-directional strength means price already moving persistently in one direction. It is a visible market-state input, not a forecast of a turn.
As of 16 February 2013, a ranking of the strongest moves among 26 widely traded ETFs listed natural gas down 72% with a 16% largest pullback and consumer discretionary up 58% with a 10% largest pullback.
A natural-gas chart was offered as a visible downtrend from about 50 to about 15 in 11 months after the 2011 high. It was presented as readable without an oscillator or an optimized moving-average envelope.
Exit, size, and abstention
The exit rule was to leave when one-way motion ends, regardless of whether the trade is already profitable. Sizing was set so a meaningful stop risks about 2% of equity.
Abstention was the explicit rule not to enter when no one-way trend is apparent. The procedure required scanning many markets. The author tracked 26 widely traded ETFs, standing aside when no trend is apparent, and rotating toward already-established trends if a home market stalls.
UNG daily price in the 2011–2013 natural-gas downtrend
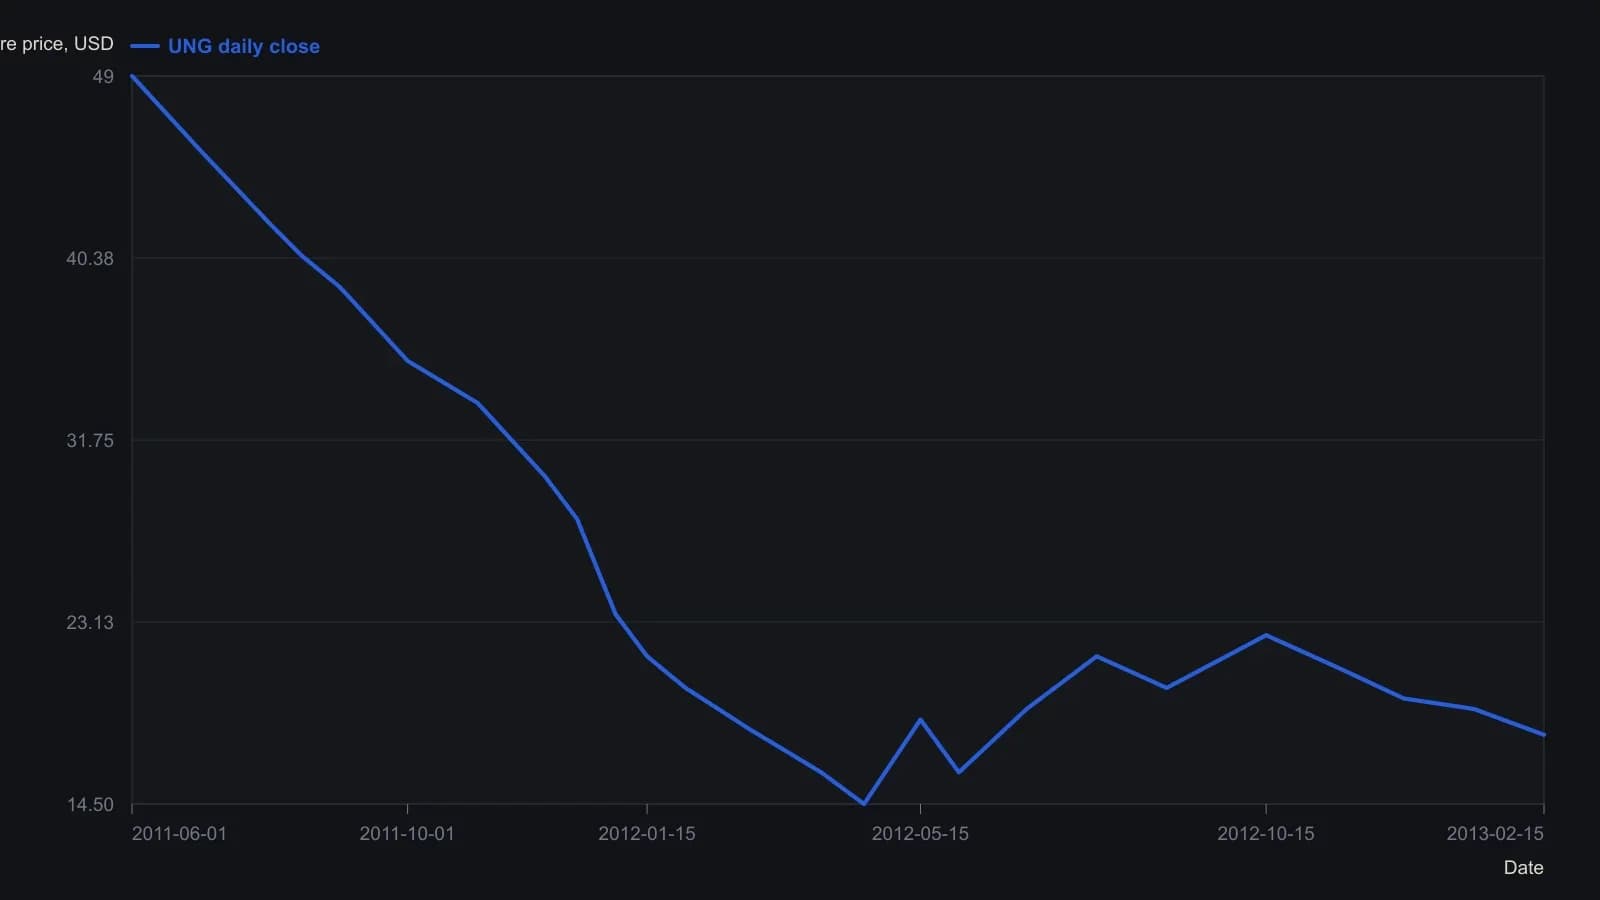
Reads are to the nearest half-dollar on a 2.5-dollar grid; only 17.78 is a printed quote. The same article’s table lists this as a 72 percent downtrend with a 16 percent largest drawdown as of 16 February 2013.
All readings on this track · 38 readings
- 1986A Marshall Wave book is assembled one confirmed stance at a time
- 1987Operator gut check when two systems conflict
- 1988Visual trend rules need one testable procedure
- 1988Audit trend and breakout rules sold without tests
- 1992Weekly 4 percent close reversal case study
- 1992Write down the plan, then wait for the cross
- 1994Constructing a three-rule moving-average system
- 1995Weekly long-only trend rules with a gated retracement exit
- 1997Constructing rainbow charts with repeated smoothing
- 1997Three-line break as a one-parameter mechanical filter
- 2000Nested horizon trend alignment with a momentum stack
- 2001When certainty turns off the stop
- 2001Price must confirm every setup
- 2001Constructing a color stack from every lookback
- 2002Evaluating mechanical trend signals from ten-session average excursions
- 2004Trend pullbacks with a fifty-day average and relative strength index
- 2005Stochastic overbought as a trend-regime state
- 2005Trend-following as one testable signal procedure
- 2007One checklist for entry, exit and abstention after a market switch
- 2008Parallel listings and divergent trend behavior
- 2008Recovery headlines versus trend-regime rules
- 2008Constructing an intraday trend procedure with confirming close, retest, and planned exits
- 2010Mechanical trend-following system design, stops, and validation
- 2010A trading-plan that sets entry, stop, trail, and pause together
- 2010Multi-horizon cycle signals, trend filters, and stops
- 2012Weekly bear-market and shock signals as a mechanical procedure
- 2013A 2013 rates week as a structure-first exit drill
- 2013Trend following as one testable procedure
- 2013A forex veto checklist: trend, pair economy, and crowd bias
- 2015Relative-strength-index rules under a 20-percent trend filter
- 2015Trend-gated oscillator entry and exit rules
- 2016Trend process versus end-goal trading
- 2017Gold as a classroom for one midterm-trend procedure
- 2017Falling-knife FX longs wait for a four-hour trend turn
- 2018A closed procedure for quarterly sector rank slots
- 2018A recursive median as shared state for trend rules
- 2020Moving-average construction as an objective trend filter
- 2020Constructing first and second cross trend entries