2012issue C0774-77
Weekly bear-market and shock signals as a mechanical procedure
A weekly Standard & Poor's 500 chart covering 1992 through 2011 displays a bear-market signal and a shock-event warning as under-price conditions. Editorial reading: sell, stand aside, and re-enter become educationally testable only as one rule set inspected after each Friday close.
- A condition is a bundled set of factors that produces a buy, a sell, or a warning aligned with the price history above it.
- The bear-market signal is a persistent under-chart sell-state for an expected serious decline. When that condition ends, recovery-mode is the mechanical re-entry window.
- The shock-event warning is a weekly-percentage-drop of more than 4.5 percent, checked once per bar in a mechanical-weekly-review after Friday's close.
- Short-lived 2011 sell states that reversed within one or two weeks are treated as acceptable stand-aside intervals, not rule failures, because re-entry remains available if the decline does not continue.
Two under-price conditions on one weekly chart
A weekly Standard & Poor's 500 chart covering 1992 through 2011 is used to display two under-price conditions: a bear-market signal and a shock-event warning.
The bear-market signal is a plotted sell-state on that weekly index chart. It marks when a serious decline regime is treated as active. The shock-event warning is a separate plotted alert for an abrupt negative weekly price shock. It is used as an early warning rather than a completed trend verdict.
S&P 500 weekly path, 1992–2012
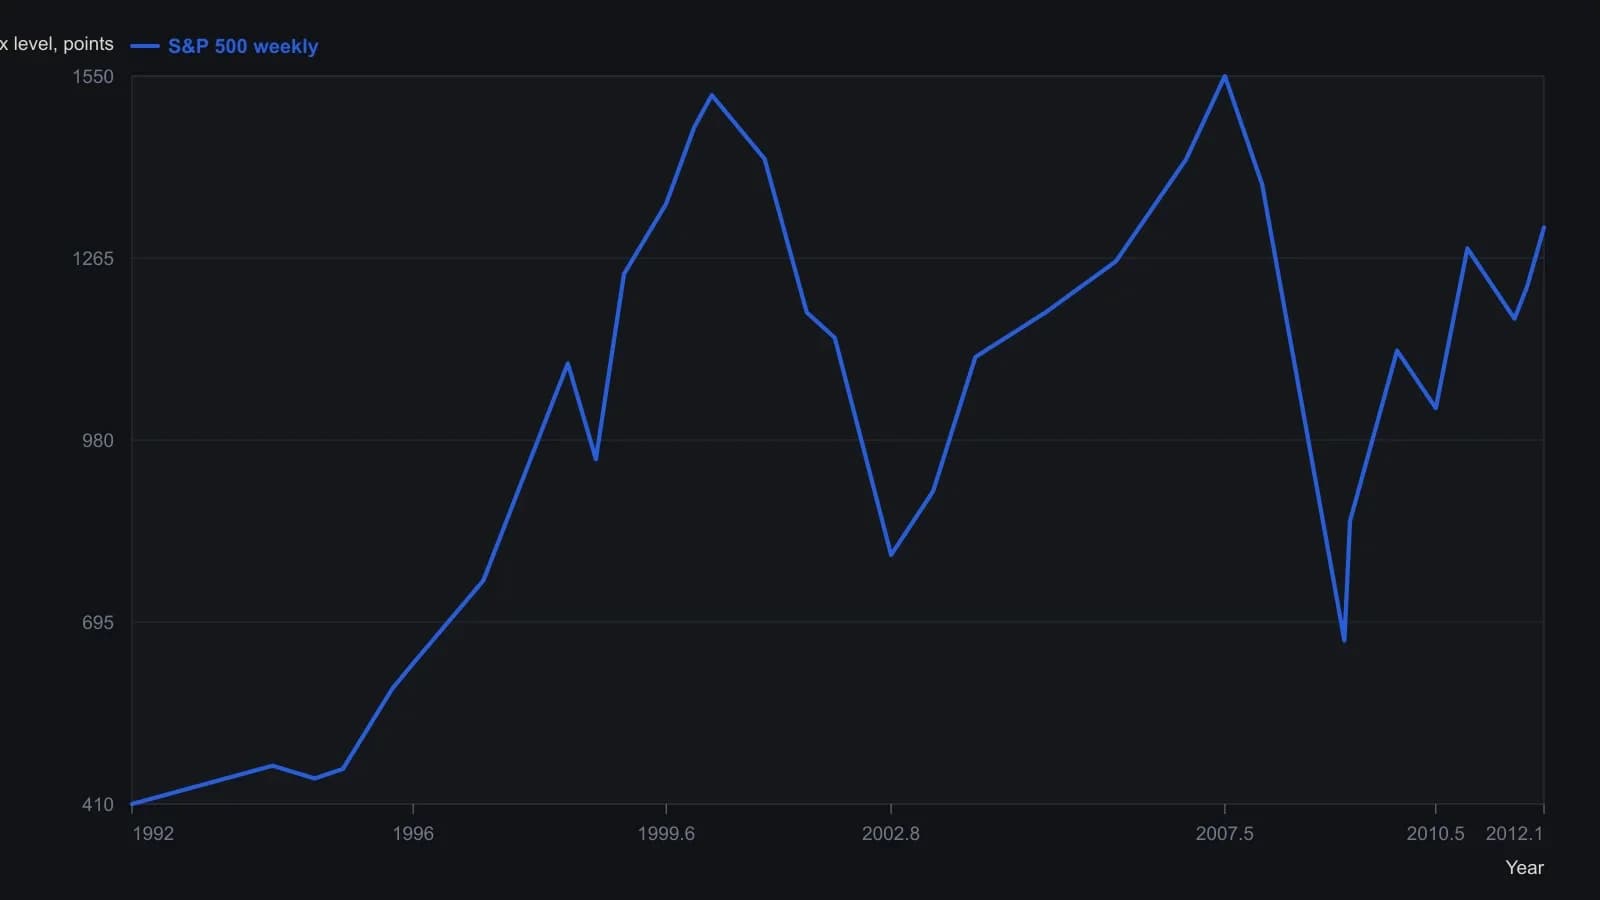
Source y-axis is marked non-linear, so unmarked levels are rounded to the nearest ten index points. The 50-week and 100-week averages and the red/yellow condition strips were not turned into extra series. Shock-event flags in the article are a 4.5 percent week-over-week drop, not a price level on this plot.
What a condition resolves to
A condition is a bundled set of rule inputs that resolves to one output: buy, sell, or warning. In this case study those outputs are aligned with the price history above the plotted state.
The bear-market signal and recovery-mode
The bear-market condition is presented as a persistent under-chart state. It marks an expected serious decline. When that condition ends, the end is treated as the start of a recovery-mode re-entry window.
Dated case-study sell states include December 2001, January 2008, 2 September 2011, and 7 October 2011.
Dated case-study end-of-bear states include May 2003 and April 2009. The April 2009 end arrived five weeks after a March 2009 low.
The shock-event warning
Shock-event detection is specified as a weekly close more than 4.5 percent below the prior week's close. That weekly-percentage-drop uses price percentage change without volume or other indicators.
One Friday-close review
The mechanical-weekly-review is scheduled after Friday's close so the weekly-percentage-drop rule can be checked once per bar. That fixed Friday-close inspection turns entry, exit, and abstention into one repeatable procedure.
Short-lived 2011 sell states that reversed within one or two weeks are treated as acceptable stand-aside intervals rather than rule failures, because re-entry remains available if the decline does not continue.
Editorial reading of the 2011 stand-aside intervals
Editorial reading: those short 2011 sell states keep sell, stand aside, and re-enter inside the same procedure. The archive presents them as part of the historical workflow, not as a later-market forecast.
All readings on this track · 38 readings
- 1986A Marshall Wave book is assembled one confirmed stance at a time
- 1987Operator gut check when two systems conflict
- 1988Visual trend rules need one testable procedure
- 1988Audit trend and breakout rules sold without tests
- 1992Weekly 4 percent close reversal case study
- 1992Write down the plan, then wait for the cross
- 1994Constructing a three-rule moving-average system
- 1995Weekly long-only trend rules with a gated retracement exit
- 1997Constructing rainbow charts with repeated smoothing
- 1997Three-line break as a one-parameter mechanical filter
- 2000Nested horizon trend alignment with a momentum stack
- 2001When certainty turns off the stop
- 2001Price must confirm every setup
- 2001Constructing a color stack from every lookback
- 2002Evaluating mechanical trend signals from ten-session average excursions
- 2004Trend pullbacks with a fifty-day average and relative strength index
- 2005Stochastic overbought as a trend-regime state
- 2005Trend-following as one testable signal procedure
- 2007One checklist for entry, exit and abstention after a market switch
- 2008Parallel listings and divergent trend behavior
- 2008Recovery headlines versus trend-regime rules
- 2008Constructing an intraday trend procedure with confirming close, retest, and planned exits
- 2010Mechanical trend-following system design, stops, and validation
- 2010A trading-plan that sets entry, stop, trail, and pause together
- 2010Multi-horizon cycle signals, trend filters, and stops
- 2012Weekly bear-market and shock signals as a mechanical procedure
- 2013A 2013 rates week as a structure-first exit drill
- 2013Trend following as one testable procedure
- 2013A forex veto checklist: trend, pair economy, and crowd bias
- 2015Relative-strength-index rules under a 20-percent trend filter
- 2015Trend-gated oscillator entry and exit rules
- 2016Trend process versus end-goal trading
- 2017Gold as a classroom for one midterm-trend procedure
- 2017Falling-knife FX longs wait for a four-hour trend turn
- 2018A closed procedure for quarterly sector rank slots
- 2018A recursive median as shared state for trend rules
- 2020Moving-average construction as an objective trend filter
- 2020Constructing first and second cross trend entries