1997issue C071-9
Constructing rainbow charts with repeated smoothing
Rainbow-charts stack successively smoothed averages so short, intermediate, and long horizons sit on one chart. The archive treats a consensus oscillator of those successive trends as the tradeable object, then pairs it with bandwidth and a stop-loss so entry, exit, and standing aside are one procedure.
- A trend is read only after prices have already begun to move, so any follow-along rule carries lag.
- Repeated-smoothing builds the rainbow stack by applying a relatively weak moving average many times, so successive passes can be watched as noisy data morph toward a smoother curve.
- The tradeable object is the rainbow-oscillator, a consensus reading of those successive trends, not a single moving average.
- Construction is completed by pairing that oscillator and bandwidth with a stop-loss, so loss bounding is part of the same procedure as the entry rule.
Trend as a delayed reading
A trend is treated as the tendency of a time-ordered data set. It is identified after prices have already begun to move, so any follow-along rule carries lag.
Signal construction uses averaging shorter than the trading horizon to suppress noise. A longer-horizon reference states the prevailing direction.
How a moving average is read
Price above a moving average is read as direction becoming more positive than during the lookback. Price below it is read as direction becoming more negative. Crossings can mark change but are not always sustained.
Several averages instead of one
Several averages used together are presented as cleaner than one average because they reduce isolated price whipsaws. The cited baselines are a two-average construction, a multi-average oscillator, and a triple-smoothed construction.
Repeated smoothing and the rainbow stack
Rainbow-charts are a color-coded stack of successively smoothed price averages that shows short, intermediate, and long horizons on one chart. The stack is built by repeated-smoothing: applying a relatively weak moving average many times so noise is reduced in stages instead of by one long lookback.
Successive passes can be watched as they morph noisy data toward a smoother curve. The moving average is used both as a filter and as the building block of that stack.
The oscillator as the tradeable object
The tradeable object is the rainbow-oscillator, a consensus reading formed from the relationships among those successive smoothings. The operator chooses a time frame from the visible family and acts on that frame rather than on a single average.
Bandwidth is the spread between the fastest and slowest members of the stack. It is used as a scale for how stretched or compressed the trend family is.
Daily close and first two-point average from the rainbow worksheet
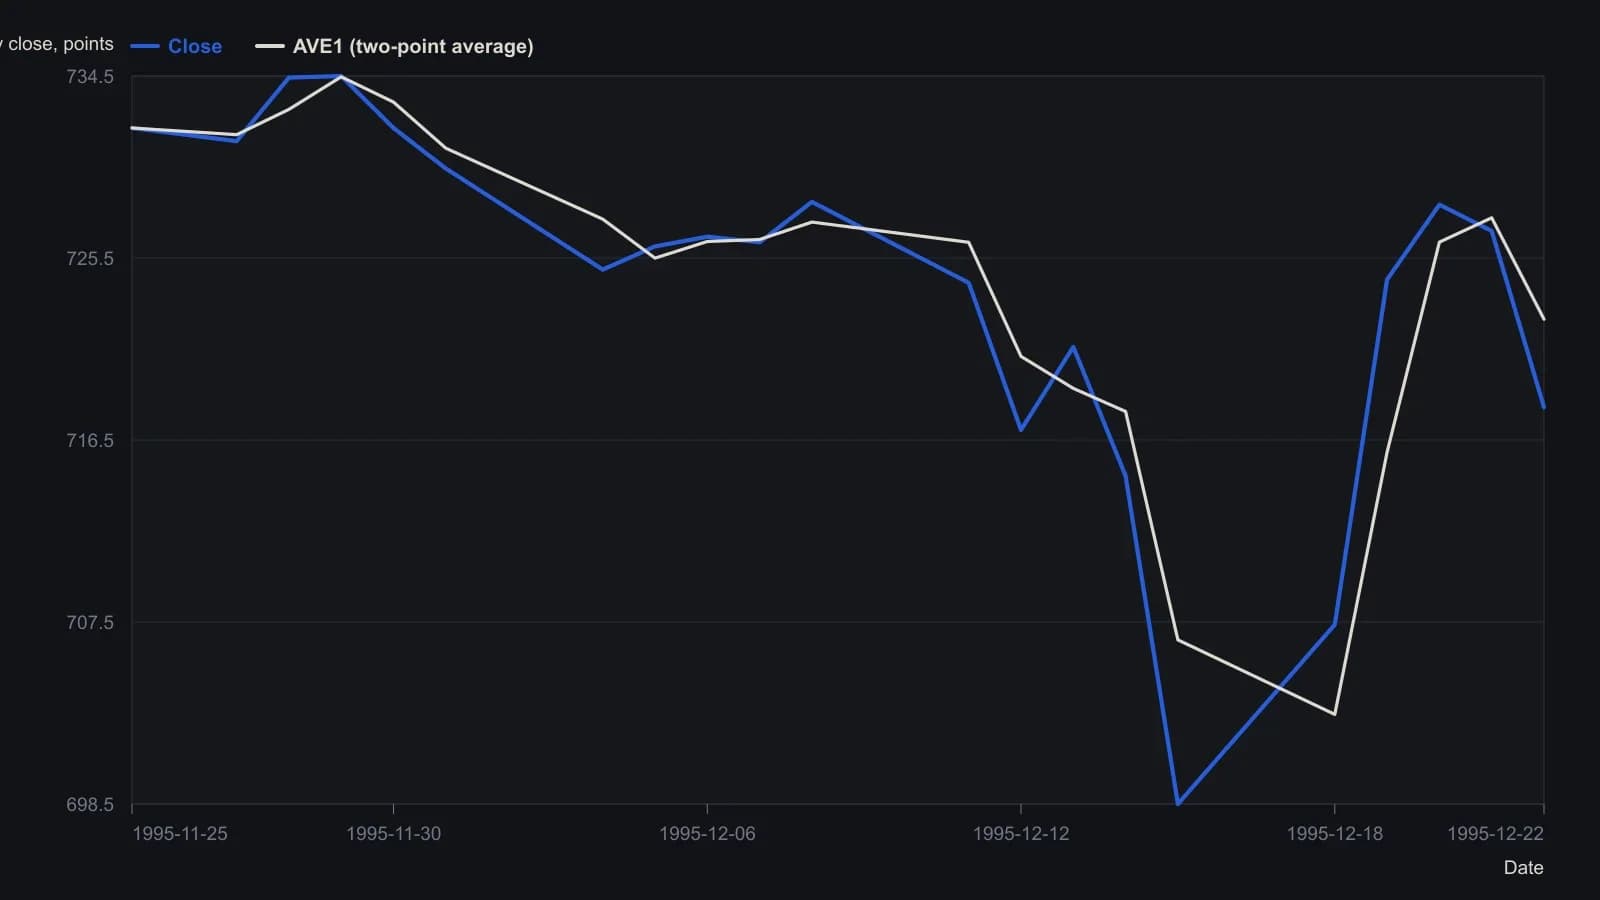
AVE1 is the two-point recursion 0.5×(close + prior close). The sheet seeds 25 Nov 1995 by writing the close into every average column. Later rainbow passes (AVE2–AVE10) and the RO/URB/LRB columns sit on the same sheet, but those later digits are too tight in the scan to transcribe without guessing.
Stop-loss as part of the same procedure
Construction is completed by pairing the oscillator and bandwidth with a stop-loss. A stop-loss is a pre-set exit that bounds loss or exposure before a position is opened and while it is open.
Together with the oscillator, that bound is part of the same procedure as the entry rule. Trend-following here means identifying a prevailing direction, staying with it, and exiting when the identified conditions change.
All readings on this track · 38 readings
- 1986A Marshall Wave book is assembled one confirmed stance at a time
- 1987Operator gut check when two systems conflict
- 1988Visual trend rules need one testable procedure
- 1988Audit trend and breakout rules sold without tests
- 1992Weekly 4 percent close reversal case study
- 1992Write down the plan, then wait for the cross
- 1994Constructing a three-rule moving-average system
- 1995Weekly long-only trend rules with a gated retracement exit
- 1997Constructing rainbow charts with repeated smoothing
- 1997Three-line break as a one-parameter mechanical filter
- 2000Nested horizon trend alignment with a momentum stack
- 2001When certainty turns off the stop
- 2001Price must confirm every setup
- 2001Constructing a color stack from every lookback
- 2002Evaluating mechanical trend signals from ten-session average excursions
- 2004Trend pullbacks with a fifty-day average and relative strength index
- 2005Stochastic overbought as a trend-regime state
- 2005Trend-following as one testable signal procedure
- 2007One checklist for entry, exit and abstention after a market switch
- 2008Parallel listings and divergent trend behavior
- 2008Recovery headlines versus trend-regime rules
- 2008Constructing an intraday trend procedure with confirming close, retest, and planned exits
- 2010Mechanical trend-following system design, stops, and validation
- 2010A trading-plan that sets entry, stop, trail, and pause together
- 2010Multi-horizon cycle signals, trend filters, and stops
- 2012Weekly bear-market and shock signals as a mechanical procedure
- 2013A 2013 rates week as a structure-first exit drill
- 2013Trend following as one testable procedure
- 2013A forex veto checklist: trend, pair economy, and crowd bias
- 2015Relative-strength-index rules under a 20-percent trend filter
- 2015Trend-gated oscillator entry and exit rules
- 2016Trend process versus end-goal trading
- 2017Gold as a classroom for one midterm-trend procedure
- 2017Falling-knife FX longs wait for a four-hour trend turn
- 2018A closed procedure for quarterly sector rank slots
- 2018A recursive median as shared state for trend rules
- 2020Moving-average construction as an objective trend filter
- 2020Constructing first and second cross trend entries