2000issue C041-6
Nested horizon trend alignment with a momentum stack
Price can be decomposed into nested horizons so that a short-term-trend sits inside an intermediate-trend, which sits inside a primary-trend, sometimes inside a secular-trend. A trend-following procedure then takes short-horizon entries, exits, and abstentions with that higher-horizon direction, while a market-cycle-stack compares the three clocks on the same date.
- Price nests a short-term-trend of about two to six weeks inside an intermediate-trend of about six weeks to nine months, inside a primary-trend of about nine months to two years, sometimes wrapped in a secular-trend of about ten to twenty-five years.
- A trend-following rule set takes short-horizon entries, exits, and abstentions with the primary-trend and treats a counter-primary trade as the higher-error branch.
- A market-cycle-stack can be built from four weighted, smoothed rate-of-change series or from stochastic-oscillator sets 3-3-3, 10-10-6, and 39-26-23, with other toolbox readings required to confirm.
- Weight-of-evidence rises when independent indicators agree, but the framework remains probabilistic and supplies no consistent method for forecasting duration or magnitude.
Price as nested clocks
Price can be decomposed into nested horizons. Short-term swings of about two to six weeks sit inside intermediate swings of about six weeks to nine months, which sit inside primary swings of about nine months to two years. Those primary swings are themselves sometimes wrapped in a secular envelope of about ten to twenty-five years.
In this vocabulary the short-term-trend is the two-to-six-week swing nested inside an intermediate-trend, or a still shorter analog on intraday bars. The intermediate-trend is the multi-week to multi-month stair-step inside a primary-trend, typically tied to shifting economic, financial, or political perceptions. The primary-trend is the dominant multi-month to multi-year swing that sets the bias for smaller nested rallies and reactions. A secular-trend is a very long envelope that spans several primary trends and commonly lasts about ten to twenty-five years.
Primary troughs are described as recurring on a cycle of just under four years, with each primary advance or decline typically lasting about nine months to two years rather than tracing a straight line.
Primary state as a classification input
Inside a primary advance, intermediate rallies tend to be the stronger leg and reactions the weaker one. Inside a primary decline the opposite pattern is expected, so the primary state is an input to how nested swings are classified.
An idealized primary advance or decline is sometimes sketched as three intermediate cycles, but that count is only a classification guide because many primary trends do not resolve into three clear intermediate waves.
Entries and exits with the higher horizon
A trend-following rule set can be specified so that short-horizon entries, exits, and abstentions are taken with the primary direction rather than against it. A counter-primary trade is treated as the higher-error branch of the procedure.
A weighted multi-horizon oscillator
A market-cycle-stack is a three-panel map that plots separately smoothed momentum at short, intermediate, and primary lookbacks so the nested clocks can be compared on the same date.
One explicit multi-horizon oscillator is built in three steps: compute four centered rates of change, smooth each with a simple or exponential moving average, then sum the four series after applying integer weights one through four. Rate-of-change here means a centered percentage change of the latest close versus a close n periods earlier, used as raw input to that smoothed oscillator.
A moving-average is the simple or exponential smoother applied to each rate-of-change series, or to price, before a weighted sum or trend state is read. When an exponential-moving-average is used, the update is the prior average plus alpha times the current deviation, and alpha is defined as two divided by the lookback length plus one.
Stochastic oscillators as three clocks
The same three-horizon map can be drawn with a stochastic-oscillator at short, intermediate, and long parameter sets, including 3-3-3, 10-10-6, and 39-26-23, provided other toolbox readings are required to confirm. The stochastic-oscillator is a bounded momentum model of where the latest close sits inside a lookback range, run here at three parameter sets to proxy the three trend clocks.
Nested stochastic clocks on Moody's Aaa yields
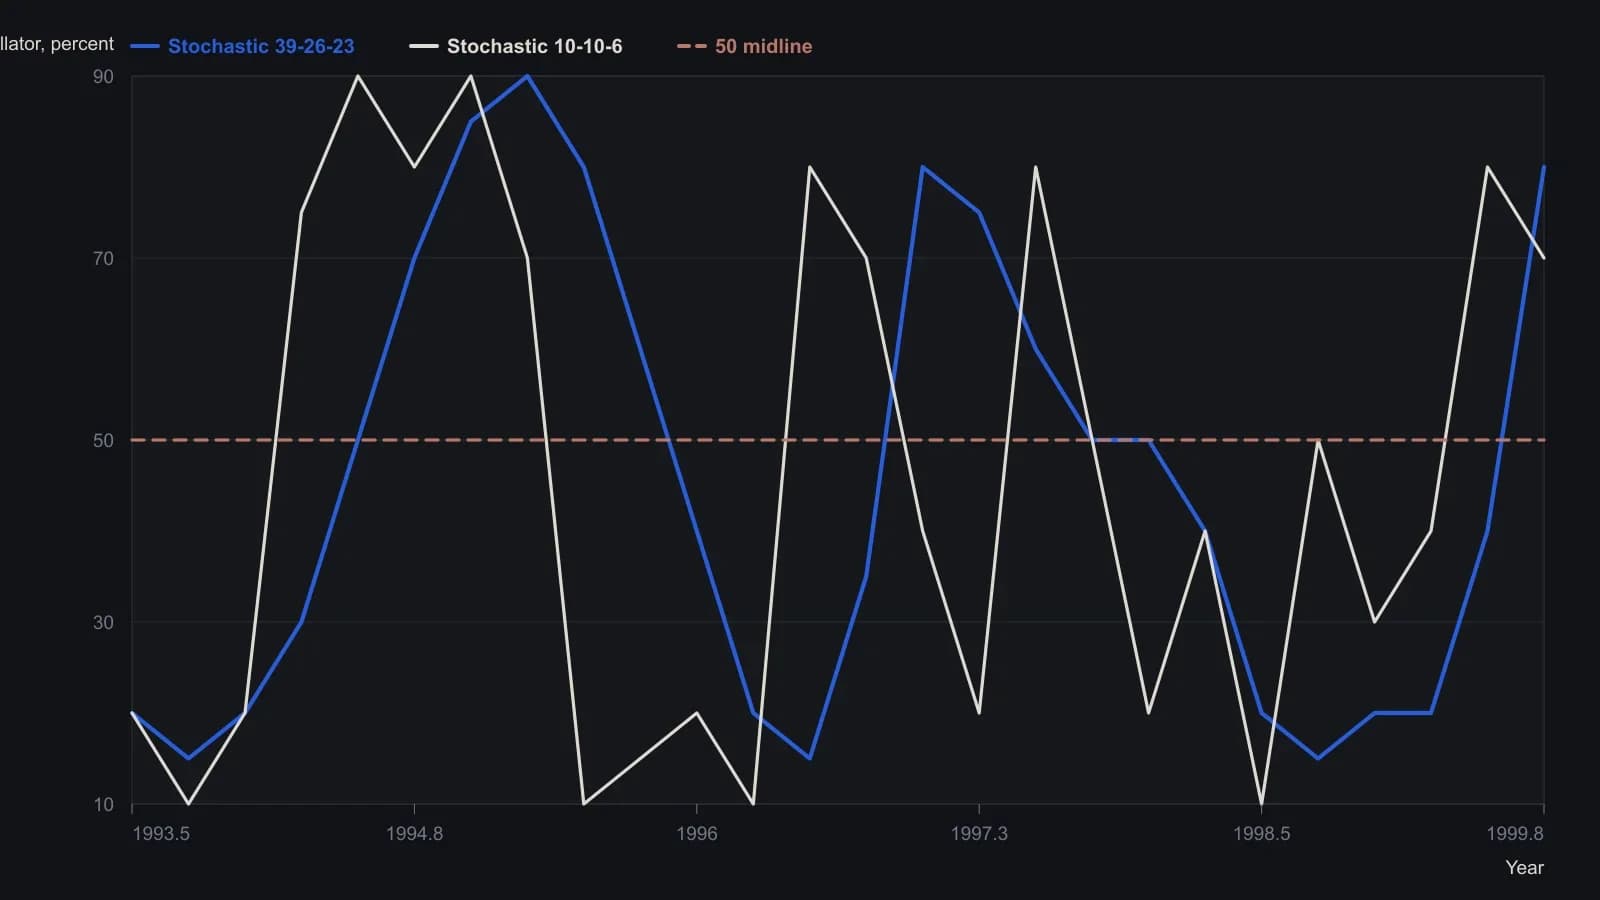
The fastest 3×3×3 panel is omitted because its 0–100 spikes are tighter than the printed raster can resolve without inventing turns. Both series use the 0–100 scale labeled on the figure (parameters 10×10×6 and 39×26×23).
Agreement without a duration forecast
Reversal confidence is treated as rising when more independent indicators agree, which is the weight-of-evidence practice of requiring several independent technical readings to agree before treating a reversal as more probable. The framework remains probabilistic: no consistent method is given for forecasting a trend's duration or magnitude.
The nesting rule is timescale-invariant. If a multi-day advance is identified as the local primary, a few-hour counterswing is not treated as a standalone short-horizon signal.
All readings on this track · 38 readings
- 1986A Marshall Wave book is assembled one confirmed stance at a time
- 1987Operator gut check when two systems conflict
- 1988Visual trend rules need one testable procedure
- 1988Audit trend and breakout rules sold without tests
- 1992Weekly 4 percent close reversal case study
- 1992Write down the plan, then wait for the cross
- 1994Constructing a three-rule moving-average system
- 1995Weekly long-only trend rules with a gated retracement exit
- 1997Constructing rainbow charts with repeated smoothing
- 1997Three-line break as a one-parameter mechanical filter
- 2000Nested horizon trend alignment with a momentum stack
- 2001When certainty turns off the stop
- 2001Price must confirm every setup
- 2001Constructing a color stack from every lookback
- 2002Evaluating mechanical trend signals from ten-session average excursions
- 2004Trend pullbacks with a fifty-day average and relative strength index
- 2005Stochastic overbought as a trend-regime state
- 2005Trend-following as one testable signal procedure
- 2007One checklist for entry, exit and abstention after a market switch
- 2008Parallel listings and divergent trend behavior
- 2008Recovery headlines versus trend-regime rules
- 2008Constructing an intraday trend procedure with confirming close, retest, and planned exits
- 2010Mechanical trend-following system design, stops, and validation
- 2010A trading-plan that sets entry, stop, trail, and pause together
- 2010Multi-horizon cycle signals, trend filters, and stops
- 2012Weekly bear-market and shock signals as a mechanical procedure
- 2013A 2013 rates week as a structure-first exit drill
- 2013Trend following as one testable procedure
- 2013A forex veto checklist: trend, pair economy, and crowd bias
- 2015Relative-strength-index rules under a 20-percent trend filter
- 2015Trend-gated oscillator entry and exit rules
- 2016Trend process versus end-goal trading
- 2017Gold as a classroom for one midterm-trend procedure
- 2017Falling-knife FX longs wait for a four-hour trend turn
- 2018A closed procedure for quarterly sector rank slots
- 2018A recursive median as shared state for trend rules
- 2020Moving-average construction as an objective trend filter
- 2020Constructing first and second cross trend entries