2020issue C0126-29
Water sleeve construction: satellite size, industry mix, and liquidity
A 2020 case used scarce usable water as the reason to consider a thematic-sleeve, then separated how much capital sat in that satellite, which sector and country mix the funds actually held, and whether assets, volume, and bid-ask-spread made the vehicles executable.
- The water sleeve was a small satellite, with 5 to 7% of capital shown as an illustrative size beside a diversified core rather than as a core-index substitute.
- Vehicles that shared the water label still rotated among industrials, utilities, and healthcare, and they ranged from a US-only book to mixed developed-market and small emerging-market sleeves.
- The five listed funds averaged under 61,000 shares a day and were grouped as long-horizon vehicles. A sixth fund closed after about $6 million in assets and volume under 1,000 shares a day.
- Low listed expenses did not clear the liquidity-filter: the newest North America-labeled fund had a 0.40% expense ratio, about 3,000 shares of daily volume, and a 0.92% average bid-ask-spread, nine times wider than the peer group.
Usable water as a theme, not a market proxy
The 2020 case framed usable water as scarce relative to the planetary total. It cited drinkable water at 0.76% and demand growth of 1% a year. That scarcity story supported a water thematic-sleeve: a bounded basket of firms whose revenue depends on one resource or industry, used as a portfolio overlay rather than a market proxy.
How large the satellite sat beside the core
Asset-allocation in this case meant sizing a satellite sleeve so one industry theme sits beside a diversified core instead of replacing it. The water-industry sleeve was presented as a small satellite allocation, with 5 to 7% of capital used as an illustrative size rather than a core-index substitute.
The same case treated water operating companies as a narrower subset of the natural-resources complex and therefore a higher-risk sleeve than a full-industry allocation.
The mix inside the water label
Industry-rotation meant choosing the utilities, industrials, healthcare, and country mix inside a named theme so the sleeve matches the intended market regime. Inside the same water label, sector weights rotated among industrials, utilities, and healthcare, while geography ranged from a US-only book to mixed developed-market and small emerging-market sleeves.
Five listed water ETFs were described as open-end, equity-only, mostly passive, mainly cap-weighted multi-cap baskets holding about 35 to 50 names. Holding concentration was not uniform: one global fund had its top five names at 31% of assets, and a later fund had about 37% in its top five. Editorial note: because those baskets were described as mostly passive, reconstitution, a scheduled index reset, can change names and weights inside the industry basket while the water label stays the same.
A tradability screen before the theme is executable
A liquidity-filter screens specialty vehicles by assets, average volume, bid-ask-spread, and survival history before treating a theme as executable. Average daily volume for those five funds sat below 61,000 shares, and the review grouped them as long-horizon vehicles rather than high-turnover trading tools.
A sixth water ETF launched in 2016 and closed in 2018 after about $6 million in assets and average volume under 1,000 shares a day. The newest North America-labeled fund combined the lowest listed expense ratio, 0.40%, with about 3,000 shares of daily volume and a 0.92% average bid-ask-spread, described as nine times wider than the peer group. Bid-ask-spread is the quoted gap between buying and selling prices. It is a direct implementation-cost input for thin specialty funds.
Water ETF cumulative returns, August 2007 to November 2019
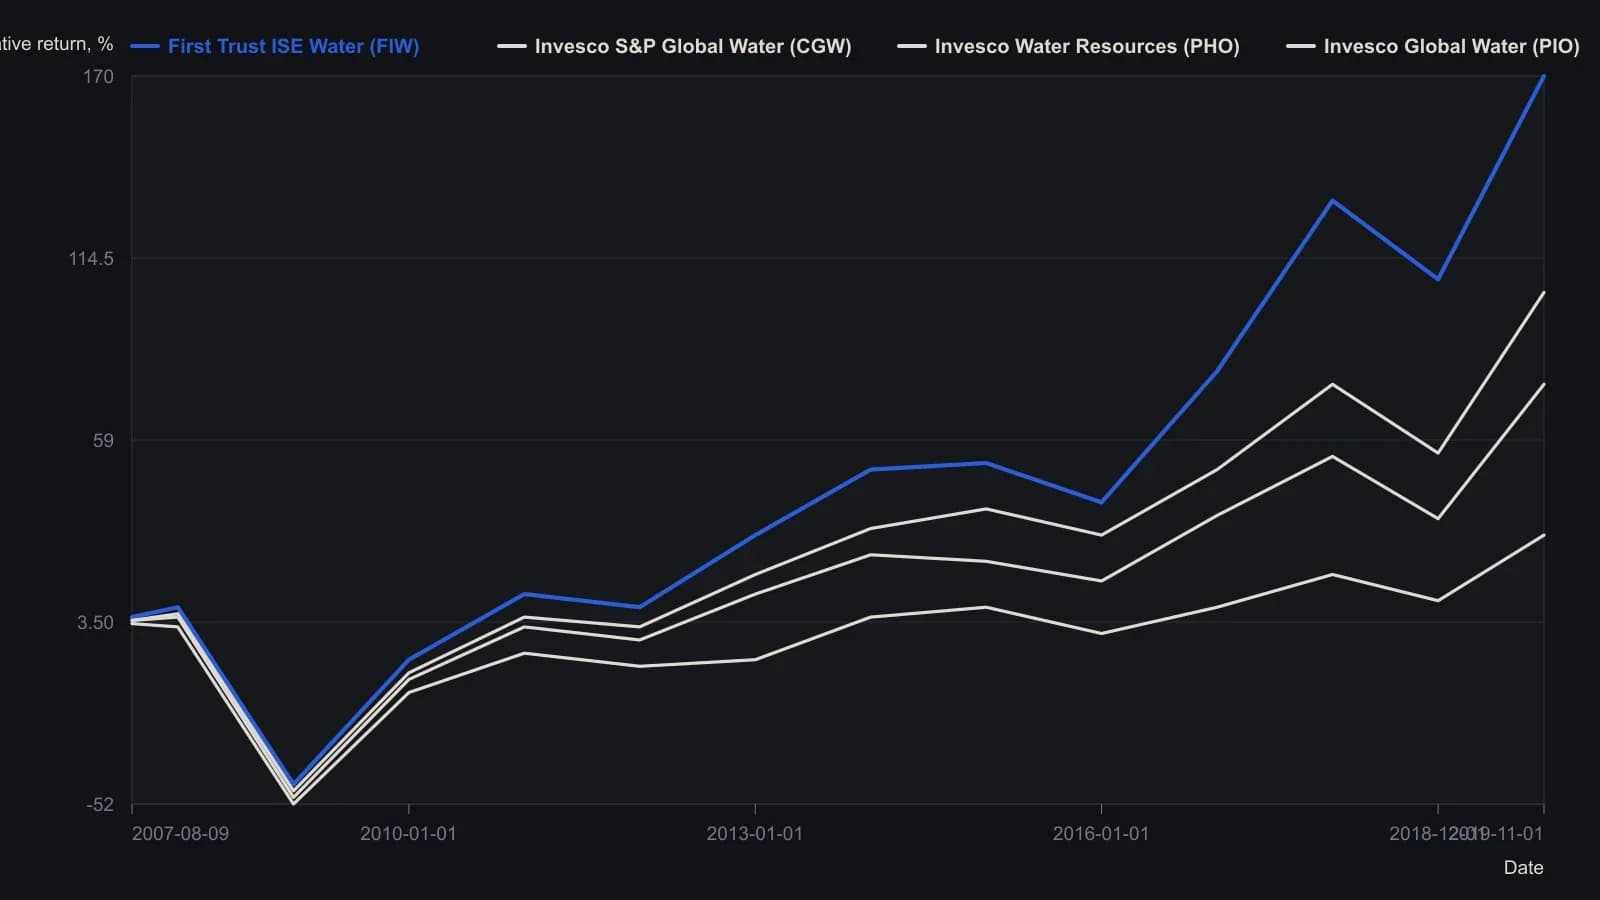
The source left out Tortoise Water because that fund only launched in 2017. The printed figure is dated 9 August 2007–1 November 2019; the prose cites a 13 June 2007 common start. Values are read from the curves and are approximate.
All readings on this track · 23 readings
- 1985Industry leadership carryover as a bull-regime test
- 1988Constructing industry-group breadth and rotation measures
- 1992Trendline holds, trailing stops, and industry rotation
- 1994Inflation-deflation regimes inside the stock cycle
- 1996Sector rotation across economic cycle phases
- 2001Rebased relative performance charts for sector rotation
- 2001Place a small-cap growth idea inside a regime map
- 2004Rebuild every industry as a share of one rank scoreboard
- 2004Rate-hike regimes and sector rotation as a case study
- 2005A two-name style-index sleeve makes rank rotation one procedure
- 2006Consumer staples after a smokestack cycle
- 2007An intra-sector regime split between builders and equity REITs
- 2008Country and sector weights in an Africa regional-sleeve
- 2011Trend permission, priced entries, and sector rotation
- 2012Construct a regime-aware context from sector rotation
- 2012Regime overlays versus rank rotation
- 2014Rank-based sector rotation as a portfolio test
- 2017Real estate as a ranked industry sleeve
- 2017Theme sleeves: liquidity and commission filters before industry rotation
- 2018Retail sleeve construction through channel rotation and daily leverage
- 2020Water sleeve construction: satellite size, industry mix, and liquidity
- 2020A ranked research terminal as a three-layer watchlist procedure
- 2020Regression channels for sector rotation context