2001issue C051-6
Rebased relative performance charts for sector rotation
Rebasing resets each close to the first observation in the window so differently priced symbols share one percentage scale. A rebased overlay, unlike a ratio line, states the size of the gap and turns an rpc baseline into a zero line for industry rotation.
- A relative-performance series sets the first close to zero and states later closes as the later price divided by that first close, minus one.
- A ratio line only shows which of two series is leading; a rebased overlay is what states the size of the gap.
- Optionable sector indexes can be ranked the same way broad benchmarks are ranked, then a second pass compares individual names to the leading group.
- Plotting sector baskets against the S&P 500 as the rpc baseline turns the broad index into a zero line for industry rotation.
How rebasing builds a relative-performance series
Relative-performance charting resets each series to a common starting value so later points show percentage change versus that start, not raw price. In the archive workflow, a relative-performance series is built by setting the first close to zero and expressing later closes as the later price divided by that first close, minus one.
That rebasing step is what puts dissimilarly priced symbols on one percentage scale. A worked Nasdaq example from mid-September 2000 maps a move from 3835.20 to 3726.50 into a rebased reading of -2.83.
Intel versus Microsoft rebased closes, January 2000
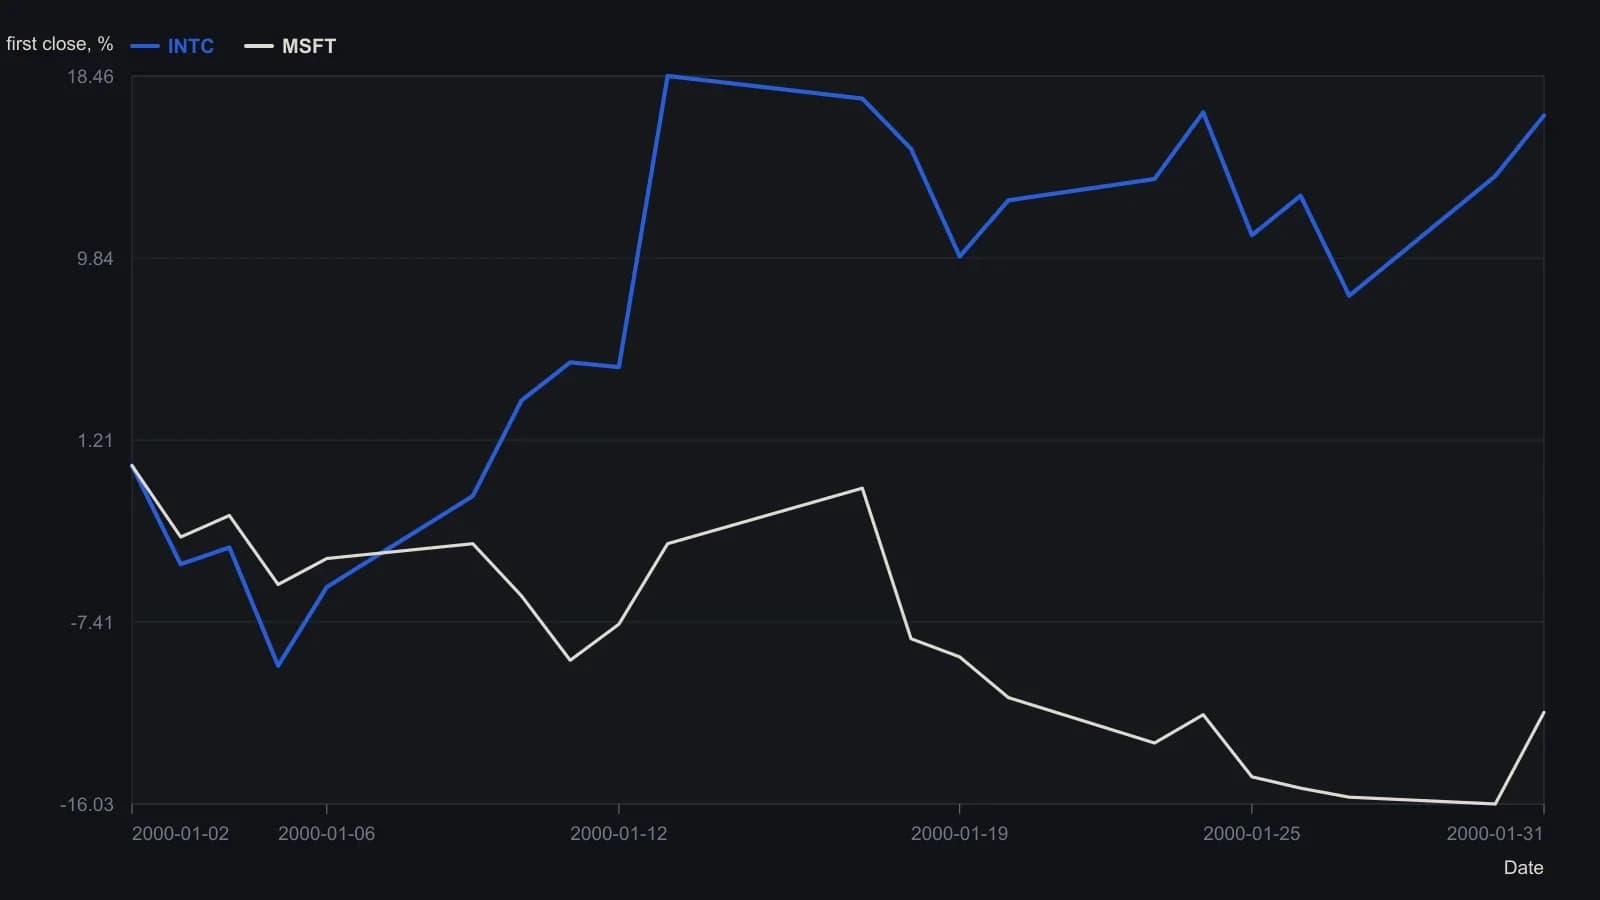
Each close is divided by that symbol's 2 January 2000 close, then one is subtracted so a later price below the start prints as a negative percentage.
Why a ratio line is not a size measure
A ratio line is a quotient of one series divided by another. It rises when the numerator outperforms and falls when it underperforms, without stating how large the gap is in percent. In the archive workflow, a price-ratio pane only shows which of two series is leading.
A rebased overlay is what states the size of the gap. One illustrated Nasdaq versus NYSE comparison showed a divergence of 25 percent. The relative-strength index, in this usage, is the ordered-price relative-strength construction used to compare those series. It is not a standalone oscillator reading.
One scale for several benchmarks
The same rebasing step lets several differently priced benchmarks share one chart without scale distortion. The archive workflow places Russell 2000, Dow industrials, S&P 500, NYSE, and Nasdaq on that shared percentage scale.
Intermarket analysis, in this setting, means reading several markets or sector proxies together so a trade sits in a cross-market, regime-aware context rather than in isolation.
Optionable sector indexes and a second pass
Sector work uses an optionable sector index as a listed stand-in for a stock group. The archive workflow uses group proxies such as BKX for banks, XOI for oil and gas, DRG for drugs, and MSH for technology, then ranks those baskets the same way broad indices are ranked.
In one illustrated window only the drug and bank baskets printed positive rebased returns while oils, technology, and the S&P 500 did not. A second pass inside the leading drug basket compared individual names to the group index and singled out Merck as the strongest of the plotted set.
The rpc baseline as a zero line
An rpc baseline is a chosen reference series, often a broad index, against which other groups are expressed so rotation shows up as relative outperformance or underperformance. Plotting sector baskets against the S&P 500 as the baseline, rather than beside it, turns the broad index into a zero line for rotation instead of another competing price series.
Two illustrated rotation windows
Industry rotation is the shift of relative leadership from one sector basket to another over weeks to months, visible when several rebases diverge instead of moving together. A technology-to-other-groups case showed the Morgan Stanley Tech 35 basket down more than 30 percent in less than a month while other groups turned higher, and about eight months later the relative ranking had inverted.
In a 1999 energy case, crude near 12 dollars a barrel coincided with a weak oil-driller basket that later, versus the S&P 500, swung from about 10 percent underperformance to 28 percent outperformance in roughly three weeks.
All readings on this track · 23 readings
- 1985Industry leadership carryover as a bull-regime test
- 1988Constructing industry-group breadth and rotation measures
- 1992Trendline holds, trailing stops, and industry rotation
- 1994Inflation-deflation regimes inside the stock cycle
- 1996Sector rotation across economic cycle phases
- 2001Rebased relative performance charts for sector rotation
- 2001Place a small-cap growth idea inside a regime map
- 2004Rebuild every industry as a share of one rank scoreboard
- 2004Rate-hike regimes and sector rotation as a case study
- 2005A two-name style-index sleeve makes rank rotation one procedure
- 2006Consumer staples after a smokestack cycle
- 2007An intra-sector regime split between builders and equity REITs
- 2008Country and sector weights in an Africa regional-sleeve
- 2011Trend permission, priced entries, and sector rotation
- 2012Construct a regime-aware context from sector rotation
- 2012Regime overlays versus rank rotation
- 2014Rank-based sector rotation as a portfolio test
- 2017Real estate as a ranked industry sleeve
- 2017Theme sleeves: liquidity and commission filters before industry rotation
- 2018Retail sleeve construction through channel rotation and daily leverage
- 2020Water sleeve construction: satellite size, industry mix, and liquidity
- 2020A ranked research terminal as a three-layer watchlist procedure
- 2020Regression channels for sector rotation context