2012issue C0810-21
Construct a regime-aware context from sector rotation
A market sector is a group of companies that conduct similar types of business. A sector rotation model describes which of those groups are expected to be most active during different periods of the economic cycle. This archive article treats that model, rate of change, and the yield curve as pieces for building market-regime context rather than as a single-stock signal.
- A market sector is a group of companies conducting similar types of business.
- A sector rotation model describes which sectors are expected to be most active during different periods of the economic cycle.
- The sector rotation model and the yield curve are presented as macro-technical tools that put stock-market technical analysis into a broader context.
- Editorial reading: assemble rotation, rate of change, and regime classification into one market context instead of chasing a single stock signal.
What a sector rotation model describes
A market sector is defined as a group of companies conducting similar types of business. A sector rotation model describes which sectors are expected to be most active during different periods of the economic cycle.
In that workflow, the sector rotation model is a cycle-based map of which industry groups tend to lead or lag as money availability and economic activity expand or contract. The archive presents two macro-technical tools, the sector rotation model and the yield curve, as ways to put stock-market technical analysis into a broader context.
Rotation and rate of change as separate pieces
Industry rotation belongs with market-regime work. It takes cross-market prices, volatility, carry, and portfolio weights on a weeks-to-months horizon, and its job is to put a single trade into a diversified or regime-aware context.
Rate of change is a different piece. It is a signal drawn from OHLC price structure and chart scale, usable from the intraday horizon to several weeks, and it turns a repeatable chart condition into a falsifiable trade hypothesis.
Editorial reading: keep the chart condition inside the rotation map. Rate of change asks whether a price condition is present. The map asks which industry groups are expected to be most active as the economic cycle shifts. Neither piece, on its own, is the full context.
Regime classification, the yield curve, and SRMIND
Market regime classification uses the same class of inputs as industry rotation: cross-market prices, volatility, carry, and portfolio weights, on a weeks-to-months horizon. It is the layer that places one trade inside a diversified or regime-aware setting.
The yield curve is a related macro-technical context tool, complementary to sector rotation, for highlighting possible market-regime turns. SRMIND is a composite long-horizon indicator that scores whether economically sensitive sectors are leading defensive ones.
Editorial reading: use SRMIND as a summary of leadership inside the rotation map, and use the yield curve as a second context check. They help assemble the regime picture. They do not replace the sector definition, the rotation map, or the rate-of-change condition.
SRMind on the Athens General Index, 2007–2012
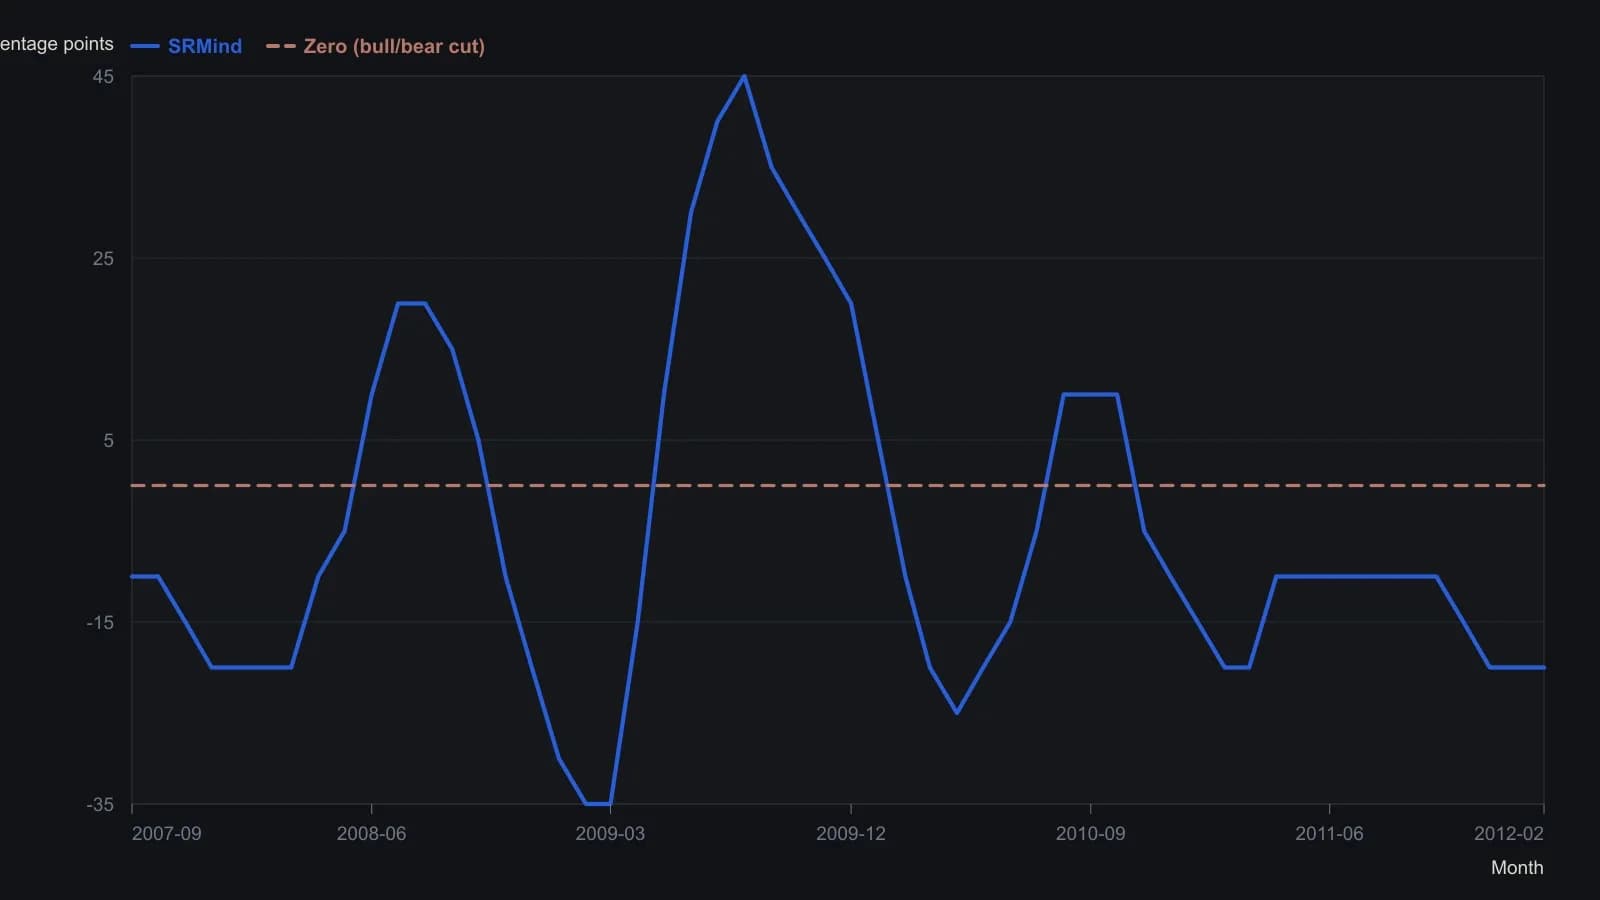
SRMind is the 75-trading-day percentage rate of change of financials and discretionary minus that of energy, staples and utilities. Siligardos treats the zero line as a bull/bear regime cut that confirms long-term technical signals, not as a standalone trigger. Histogram bars are daily; values here are monthly readings rounded to the nearest 5 points.
All readings on this track · 23 readings
- 1985Industry leadership carryover as a bull-regime test
- 1988Constructing industry-group breadth and rotation measures
- 1992Trendline holds, trailing stops, and industry rotation
- 1994Inflation-deflation regimes inside the stock cycle
- 1996Sector rotation across economic cycle phases
- 2001Rebased relative performance charts for sector rotation
- 2001Place a small-cap growth idea inside a regime map
- 2004Rebuild every industry as a share of one rank scoreboard
- 2004Rate-hike regimes and sector rotation as a case study
- 2005A two-name style-index sleeve makes rank rotation one procedure
- 2006Consumer staples after a smokestack cycle
- 2007An intra-sector regime split between builders and equity REITs
- 2008Country and sector weights in an Africa regional-sleeve
- 2011Trend permission, priced entries, and sector rotation
- 2012Construct a regime-aware context from sector rotation
- 2012Regime overlays versus rank rotation
- 2014Rank-based sector rotation as a portfolio test
- 2017Real estate as a ranked industry sleeve
- 2017Theme sleeves: liquidity and commission filters before industry rotation
- 2018Retail sleeve construction through channel rotation and daily leverage
- 2020Water sleeve construction: satellite size, industry mix, and liquidity
- 2020A ranked research terminal as a three-layer watchlist procedure
- 2020Regression channels for sector rotation context