2008issue C111-4
Country and sector weights in an Africa regional-sleeve
Archive listed-wrappers from 2007 and 2008 placed Africa and Middle East and Africa labels on a handful of hosts and on bank, resource, energy, and telecom sector-stacks. The construction audit asks whether the regional-sleeve is a distinct growth-and-liquidity regime or those same exposures under a continent name.
- By 2007, continental real GDP growth above 5% for a fourth year and a larger inward-fdi stock still left most 2006 flows in South Africa, Nigeria, Egypt, Morocco, and Tunisia, without a higher regional share of global FDI.
- Listed-wrappers under Africa or Middle East and Africa labels showed country-concentration in South Africa, Egypt, Morocco, and Nigeria, even when the name list ran to hundreds of stocks.
- Sector-stacks were heavy in financials or banks, then telecommunications, materials or basic resources, and oil and gas, so industry-rotation inside the label mattered as much as the continent name.
- South Africa sat outside the frontier-market bucket with the continent's largest exchange, while the cited venues were still described as a small listed universe with thin liquidity and high-volatility risk.
Growth and the inward-fdi map
By 2007, continental real GDP growth was reported above 5% for a fourth straight year. The same setting included a positive fiscal balance, more inflation-targeting central banks, and still-high poverty.
Inward-fdi rose from 2.4 billion dollars in 1985 to 36 billion dollars in 2006 and then held at that level in 2007. That rise did not lift the region's share of global FDI.
In 2006, five hosts absorbed most regional inward-fdi: South Africa 24%, Nigeria 13%, Egypt 12%, Morocco 10%, and Tunisia 7%.
Commodity prices as an incomplete driver
Commodity prices were treated as a major but incomplete growth driver. Higher metal and soft-commodity receipts were offset by costlier food and energy imports. Inward-fdi clustered in natural resources and services rather than manufacturing.
Venues, liquidity, and the frontier-market split
Venues cited for a regional-sleeve included South Africa, Egypt, Morocco, Tunisia, Namibia, Botswana, Nigeria, and Kenya. South Africa's exchange, founded in 1887, was described as the continent's largest, with developed equity and derivatives markets.
South Africa was treated as outside the frontier-market bucket, with dedicated local listed-wrappers available. The cited markets were characterized as sharing a small listed universe, thin liquidity, and high-volatility risk.
Country-concentration in listed-wrappers
One Middle East and Africa index product held 341 names at year-end 2007. On 10 July 2008 it allocated 52.82% to South Africa, 8.91% to Morocco, 6.78% to Egypt, and 1.42% to Nigeria.
A fifty-name Africa index launched in July 2008 required more than 200 million dollars of capitalization. The related listed-wrapper's 9 July mix was Nigeria 25%, South Africa 24.7%, Egypt 13.1%, and Morocco 11.4%.
A July 2008 Middle East and North Africa wrapper placed 20.6% in Egypt and 13.32% in Morocco. A September 2008 Middle East and Africa fund showed African weights of Egypt 16.4%, South Africa 9.8%, and Nigeria 0.9%.
Sector-stack behind the geography label
The July 2008 Middle East and North Africa wrapper placed financials at 55.1%, telecommunications 19.05%, industrials 12.48%, and materials 10.36%.
The fifty-name Africa listed-wrapper mixed banks 33.7%, basic resources 18.2%, oil and gas 13.5%, telecommunications 10.2%, and technology 7.3%. The September 2008 Middle East and Africa fund held financials at 57.7%.
Host-country weights in 2008 Africa-labeled listed wrappers
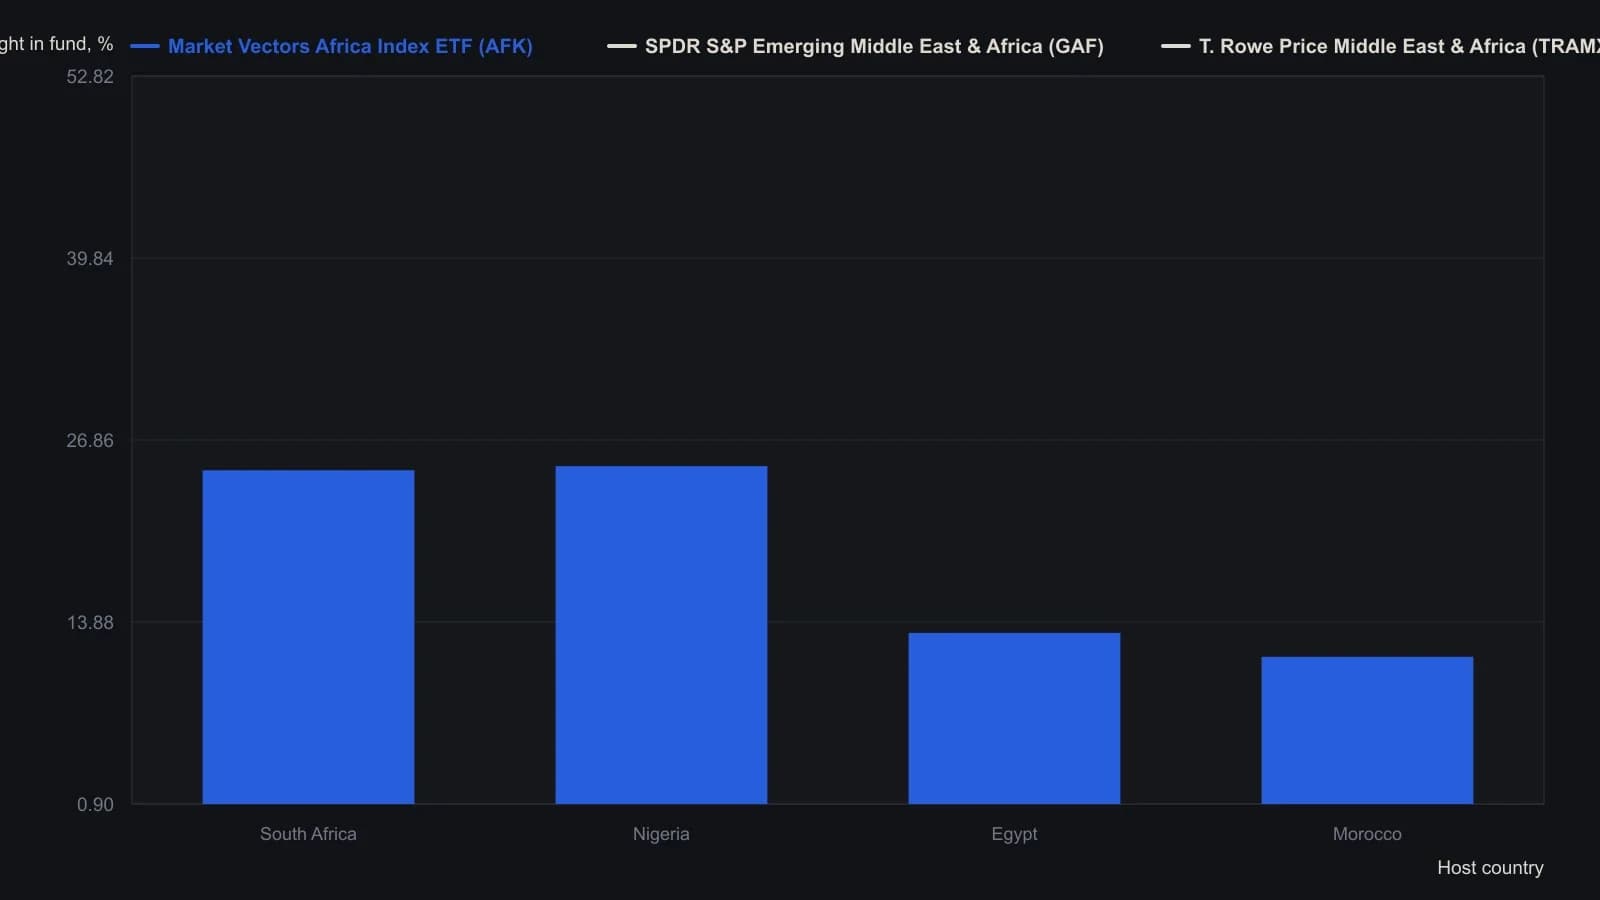
Each series is a single-date snapshot (AFK 9 July 2008, GAF 10 July 2008, TRAMX 8 September 2008). Only African hosts the source named are shown; remaining weights sat in other countries, including Middle East names in GAF and TRAMX.
How the construction audit sizes the sleeve
Editorial reading: asset-allocation sets how large the regional-sleeve may be only after liquidity, country-concentration, and the rest of the book are known. Diversification holds if the sleeve's drivers and constraints differ from the core book, not because the geography label is new.
Editorial reading: industry-rotation among banks, resources, energy, telecoms, and other groups is the mix decision when the regional weights or the commodity regime change. If the residual after the large hosts and the bank-and-resource sector-stack is small, the sleeve restates those same exposures rather than adding a distinct growth-and-liquidity regime.
All readings on this track · 23 readings
- 1985Industry leadership carryover as a bull-regime test
- 1988Constructing industry-group breadth and rotation measures
- 1992Trendline holds, trailing stops, and industry rotation
- 1994Inflation-deflation regimes inside the stock cycle
- 1996Sector rotation across economic cycle phases
- 2001Rebased relative performance charts for sector rotation
- 2001Place a small-cap growth idea inside a regime map
- 2004Rebuild every industry as a share of one rank scoreboard
- 2004Rate-hike regimes and sector rotation as a case study
- 2005A two-name style-index sleeve makes rank rotation one procedure
- 2006Consumer staples after a smokestack cycle
- 2007An intra-sector regime split between builders and equity REITs
- 2008Country and sector weights in an Africa regional-sleeve
- 2011Trend permission, priced entries, and sector rotation
- 2012Construct a regime-aware context from sector rotation
- 2012Regime overlays versus rank rotation
- 2014Rank-based sector rotation as a portfolio test
- 2017Real estate as a ranked industry sleeve
- 2017Theme sleeves: liquidity and commission filters before industry rotation
- 2018Retail sleeve construction through channel rotation and daily leverage
- 2020Water sleeve construction: satellite size, industry mix, and liquidity
- 2020A ranked research terminal as a three-layer watchlist procedure
- 2020Regression channels for sector rotation context