2020issue C1042-47
A ranked research terminal as a three-layer watchlist procedure
The archive presents a ranked terminal as a research desk rather than a published model portfolio. This editorial article sequences that desk into three layers: market-wide distribution and volume counts as a permission switch, industry-rotation toward groups with a better high-to-low balance, and a breakout or pivot that only becomes a watchlist item after independent chart and earnings work.
- Market context is built from a prior-session comment, an uptrend-or-not outlook, distribution-day counts on the S&P 500 and Nasdaq, and a four-way stock-action tally that can be logged in a spreadsheet.
- Rank-rotation uses sortable live fields, including composite-rating, earnings-per-share rating, and relative-strength rating, as a first research step rather than a buy list.
- Industry-rotation compares daily group percentage change with that day's new highs and new lows so a breakout is not treated as equally well situated in every sleeve.
- A breakout past a pivot is a hypothesis trigger for the watchlist. Chart work, news, and earnings review still come before any buy or sell decision.
What the terminal is organized to do
The reviewed platform is presented as a 2010 outgrowth of a 1972 charting service. Its screening approach is organized around seven lettered fundamental and technical characteristics. It is not offered as a published model portfolio.
Ranked lists and reports are described as a first research step only. Users are expected to keep a watchlist, apply their own chart work, and review news and earnings before any buy or sell decision.
Layer one: market permission
Daily market context is framed with a short prior-session comment, an uptrend-or-not outlook, and a running count of distribution days on the S&P 500 and Nasdaq.
A distribution-day is a session in which a major index closes down 0.2% or more on heavier volume than the prior day. Clusters of such days are treated as a sign that large-account selling is accelerating.
The daily stock-action panel tracks four countable conditions: up on volume, down on volume, today's breakouts, and names near their pivots. Those counts can be logged in a spreadsheet to judge market strength or weakness. In this editorial reading, the balance of those counts is the permission switch that decides whether rank-rotation proceeds, pauses, or abstains.
Rank-rotation inside the live tables
Clicking any of those four counts opens a sortable table of live fields such as price, percent change, market cap, volume, earnings-per-share rating, relative-strength rating, group relative strength, SMR rating, accumulation/distribution rating, and composite-rating.
Rank-rotation is a repeatable scan that ranks names by composite-rating, earnings, relative-strength, and related scores so the same screening steps can produce an entry, exit, or abstention decision. The composite-rating is a single sortable score that combines several proprietary fundamental and technical inputs so a table can be ordered without mixing incompatible metrics.
MarketSmith stock-action counts, 29 June 2020
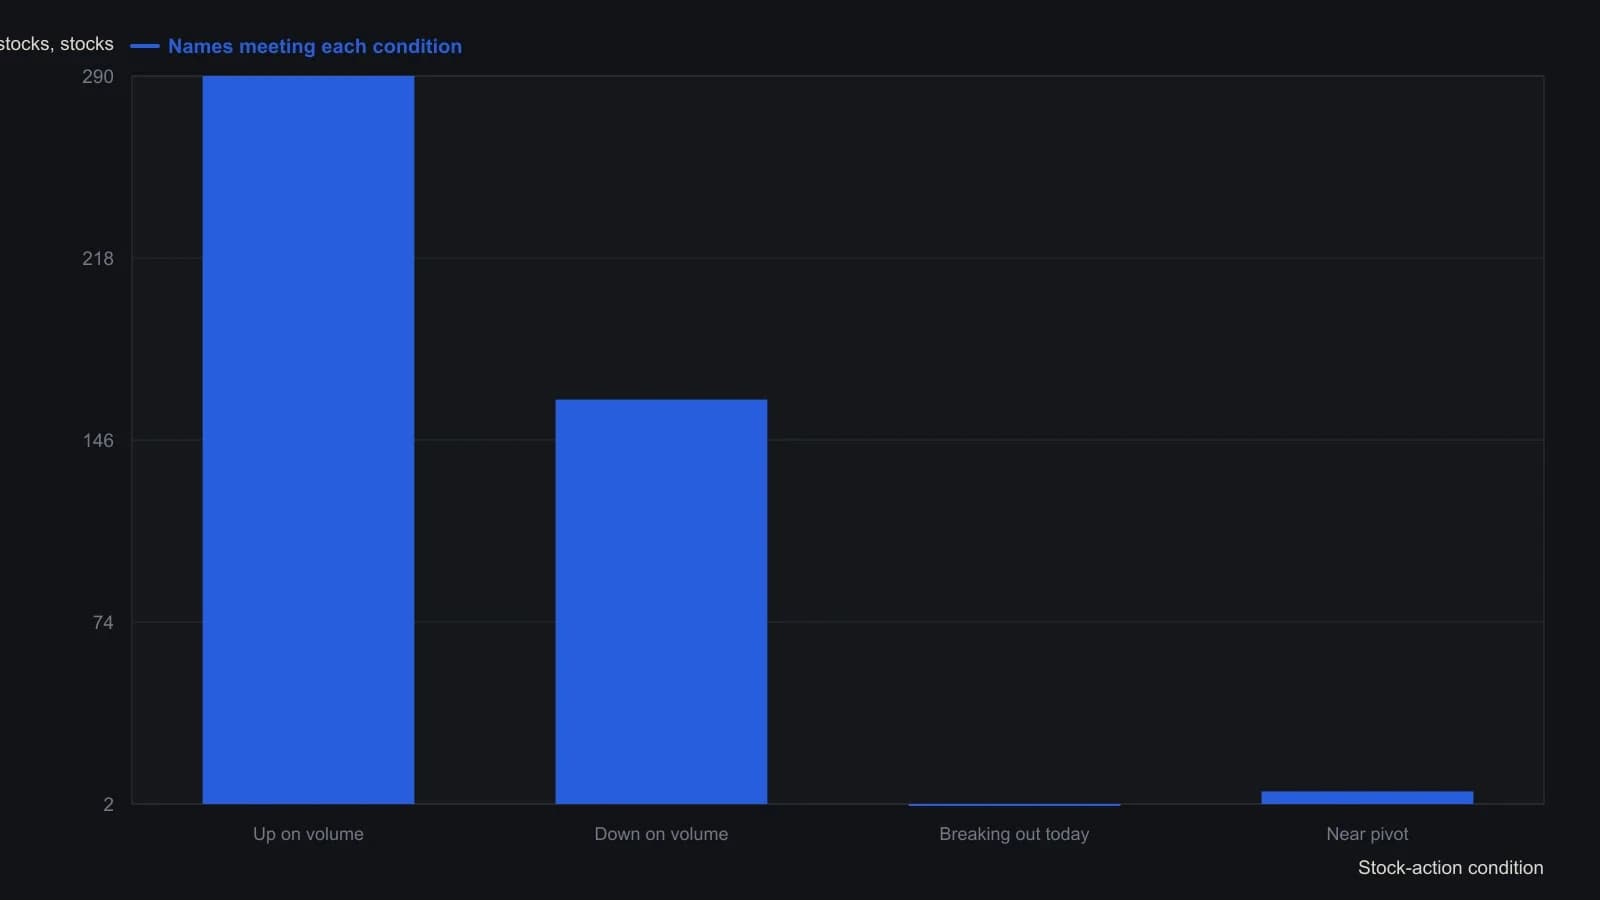
These are one-session counts from the homepage capture, not a time series. The same review’s 11 June tape was a different session, with 1,078 names down on volume.
Layer two: industry-rotation
Industry-group reports include top daily percentage change plus that day's new highs and new lows. A user can compare group opportunity and the high-to-low balance rather than treating every breakout as equally well situated.
Industry-rotation is the comparison of industry-group percentage change, new highs, and new lows to decide which sleeves of the market currently deserve more watchlist weight. In this editorial reading, expanding new highs are the cue to give a sleeve more attention, and a weaker high-to-low balance is a reason to hold a name back even if a pivot is nearby.
Layer three: breakout as a watchlist hypothesis
A breakout is a price-structure event in which a name clears a defined pivot or range. It is used here as a hypothesis trigger rather than an automatic buy. A pivot is a predefined price level near which a name is monitored so a later breakout confirmation can be checked against the same chart scale.
The stock-action panel already isolates today's breakouts and names near their pivots. Those rows still sit behind the market permission switch and the industry-rotation comparison. The archive expects the user to apply independent chart work and to review news and earnings before any buy or sell decision.
The same ranking during the session
A mobile companion can push price alerts and real-time breakout notices. Names already on a watchlist can be checked during the session against the same ranking and chart context used on the desktop.
All readings on this track · 23 readings
- 1985Industry leadership carryover as a bull-regime test
- 1988Constructing industry-group breadth and rotation measures
- 1992Trendline holds, trailing stops, and industry rotation
- 1994Inflation-deflation regimes inside the stock cycle
- 1996Sector rotation across economic cycle phases
- 2001Rebased relative performance charts for sector rotation
- 2001Place a small-cap growth idea inside a regime map
- 2004Rebuild every industry as a share of one rank scoreboard
- 2004Rate-hike regimes and sector rotation as a case study
- 2005A two-name style-index sleeve makes rank rotation one procedure
- 2006Consumer staples after a smokestack cycle
- 2007An intra-sector regime split between builders and equity REITs
- 2008Country and sector weights in an Africa regional-sleeve
- 2011Trend permission, priced entries, and sector rotation
- 2012Construct a regime-aware context from sector rotation
- 2012Regime overlays versus rank rotation
- 2014Rank-based sector rotation as a portfolio test
- 2017Real estate as a ranked industry sleeve
- 2017Theme sleeves: liquidity and commission filters before industry rotation
- 2018Retail sleeve construction through channel rotation and daily leverage
- 2020Water sleeve construction: satellite size, industry mix, and liquidity
- 2020A ranked research terminal as a three-layer watchlist procedure
- 2020Regression channels for sector rotation context