2007issue C121-3
An intra-sector regime split between builders and equity REITs
In the 2007 window described, housing-lead-indicators and builder earnings marked a weak residential regime while equity-REITs in the same broad property grouping stayed comparatively firm on occupancy, earnings, and takeover-driven listed supply. Editorial view: classify the two industries as separate folders before any rotation sleeve is treated as one trade.
- Market-regime-classification labels a persistent cluster of price, credit, occupancy, and inventory conditions so a name is read against its industry state, not a blended property story.
- Housing-lead-indicators, including builder sentiment, permits, and months-of-supply, dated a weak residential regime while commercial occupancy and listed equity-REIT conditions remained comparatively firm.
- A fundamental-overlay of earnings trajectories, vacancy and lease conditions, credit, and corporate-control activity explained why the two industries could travel in opposite directions.
- Editorial view: industry-rotation between related property industries is a folder decision, not a sector call, and should wait until those regimes have been classified separately.
A folder split, not a sector call
When two industries share a property label, the first task is to classify them separately. In the 2007 window described, residential housing activity and homebuilder outlook weakened while listed equity real-estate vehicles in the same broad property grouping remained comparatively firm.
An equity-REIT is a listed vehicle that owns income-producing commercial property such as offices, hotels, or healthcare facilities rather than for-sale residential inventory. Market-regime-classification means labeling a persistent cluster of price, credit, occupancy, and inventory conditions so a single name is read against its industry state rather than a blended sector story.
Housing-lead indicators dated the residential regime
Housing-lead-indicators are forward-looking residential gauges such as builder sentiment surveys, permits, and unsold months of supply used to date a housing-demand regime. After a brief rebound from a 16-year low, a national homebuilder sentiment survey returned to a reading of 30 and later fell to 24.
Housing permits posted an 8.9 percent monthly drop and then another 7.5 percent decline, while unsold existing-home inventories rose to 8.4 months of supply and later 8.9 months. Months-of-supply is unsold existing-home inventory expressed as how many months current sales would take to clear that stock.
Homebuilding executives and industry spokespeople characterized the residential slump as unfinished and more severe than recently assumed, so a near-term housing turnaround was treated as unrealistic in that setting. The residential side was described as a hangover from earlier low-rate conditions and tighter credit after subprime stress.
Commercial demand kept the listed property folder firmer
Over a roughly 22-month span from late 2005, a building industry group was shown down more than 30 percent while an equity-REIT group was shown up nearly 15 percent. The split was tied to firm commercial demand, including tight office vacancies and higher lease rates, stronger hotel occupancy, and steady healthcare-property need.
Earnings paths and takeover activity as a fundamental overlay
A fundamental-overlay uses earnings trajectories, vacancy and lease conditions, credit availability, and corporate-control activity to interpret why related industries can travel in opposite directions. After 2003, equity-REIT earnings growth was described as rising from about 12 percent to more than 20 percent, with earnings per share up 61 percent, while builder earnings per share were described as halved and the growth rate negative.
Takeover activity, including a record-sized office-portfolio purchase and several hospitality names that were among the strong listed performers in that window, was cited as shrinking the public REIT menu as demand met reduced listed supply. Announced property acquisitions were described as totaling well over 115 billion dollars in 2006, up from 15 billion dollars in 2004.
Builders versus equity REITs, July 2005–May 2007
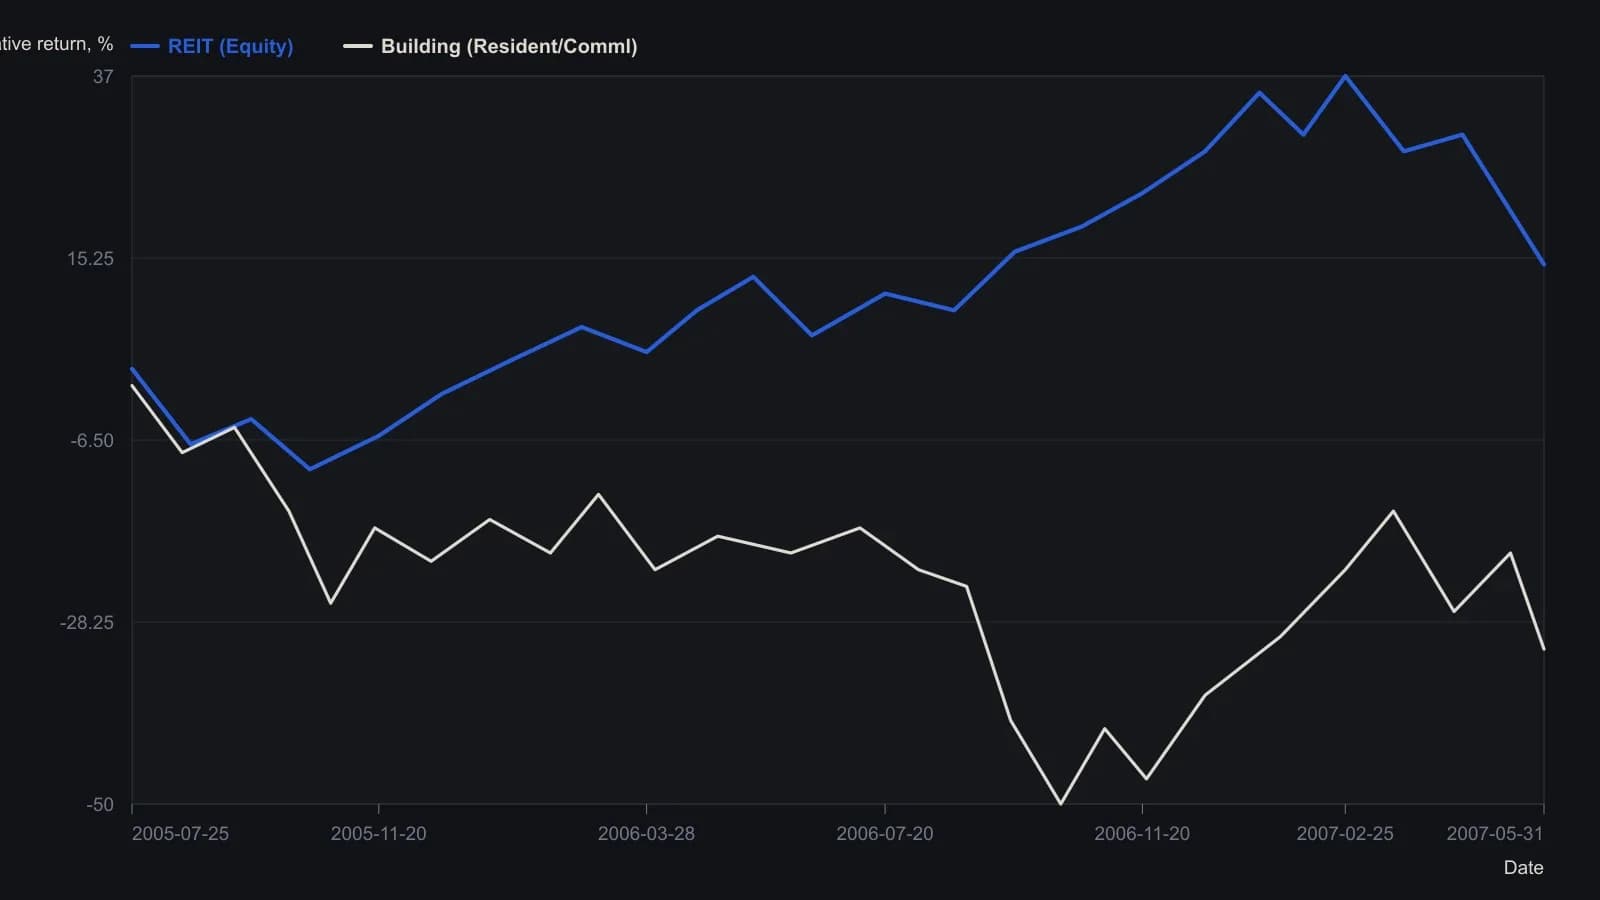
Intermediate points are approximate readings from the raster. Endpoints are the percentages printed on the figure.
When industry-rotation is not yet one trade
Industry-rotation is shifting exposure between industries when they occupy different demand, credit, or earnings regimes even though they sit under one sector label. In the archive window, the property label bundled a weak residential folder with a firmer commercial listed folder.
Editorial view: keep the folders separate until housing-lead-indicators, commercial occupancy, earnings paths, and takeover-driven public supply agree. Only then is a rotation sleeve coherent as a single trade rather than two industry states sharing a name.
All readings on this track · 23 readings
- 1985Industry leadership carryover as a bull-regime test
- 1988Constructing industry-group breadth and rotation measures
- 1992Trendline holds, trailing stops, and industry rotation
- 1994Inflation-deflation regimes inside the stock cycle
- 1996Sector rotation across economic cycle phases
- 2001Rebased relative performance charts for sector rotation
- 2001Place a small-cap growth idea inside a regime map
- 2004Rebuild every industry as a share of one rank scoreboard
- 2004Rate-hike regimes and sector rotation as a case study
- 2005A two-name style-index sleeve makes rank rotation one procedure
- 2006Consumer staples after a smokestack cycle
- 2007An intra-sector regime split between builders and equity REITs
- 2008Country and sector weights in an Africa regional-sleeve
- 2011Trend permission, priced entries, and sector rotation
- 2012Construct a regime-aware context from sector rotation
- 2012Regime overlays versus rank rotation
- 2014Rank-based sector rotation as a portfolio test
- 2017Real estate as a ranked industry sleeve
- 2017Theme sleeves: liquidity and commission filters before industry rotation
- 2018Retail sleeve construction through channel rotation and daily leverage
- 2020Water sleeve construction: satellite size, industry mix, and liquidity
- 2020A ranked research terminal as a three-layer watchlist procedure
- 2020Regression channels for sector rotation context