1996issue C031-11
Sector rotation across economic cycle phases
A 25-year comparison of 88 S&P 500 industries used a five-phase economic-cycle map and counted how often groups beat the market, then treated a 12-month Relative Strength Index series as a later screen rather than as a complete entry rule.
- A five-phase map with three expansion stages, a defensive contraction stage, and an interest-sensitive contraction stage classified when industry groups showed their strongest results.
- Outperformance was scored by count of cycle phases, not average percentage, and a batting-average mark of 1 required beating the market more than twice in four expansions of a given phase.
- A 12-month Relative Strength Index series was treated as a long-horizon screen for cheap or expensive industry situations, with occasional shorter-horizon usefulness as well.
- Historical phase scores were not treated as sufficient on their own. Industry write-ups and changing structural conditions were required before converting a rotation signal into a position.
A five-phase economic-cycle map
A five-phase economic-cycle map was used to classify when industry groups historically showed their strongest results. The five phases were three expansion stages, a defensive contraction stage, and an interest-sensitive contraction stage.
A 25-year industry study covering four complete expansions and five contractions split each expansion into equal thirds, then compared 88 S&P 500 industries with the S&P 500 over those same windows.
How outperformance was scored
Outperformance was scored by count of cycle phases, not average percentage, so one oversized win could not disguise repeated underperformance.
An industry received a batting-average mark of 1 only when it beat the market more than twice in four expansions of a given phase, a bar set above 50 percent.
A rotational pattern across sectors
A rotational pattern across 10 sectors was tabulated to show, in general, which groups posted their best results in each phase of the cycle.
Household products, tobacco, broadcast media, and newspaper publishers posted high batting averages, while autos, airlines, computer systems, and heavy-duty trucks scored from 1 to zero, meaning no consistent phase of market outperformance.
A 12-month relative-strength screen
A 12-month Relative Strength Index series was treated as a long-horizon screen for cheap or expensive industry situations, with occasional shorter-horizon usefulness as well.
From a rotation signal to a position
Historical phase scores were not treated as sufficient on their own. Industry write-ups and changing structural conditions were required before converting a rotation signal into a position.
Industry batting averages versus the S&P 500
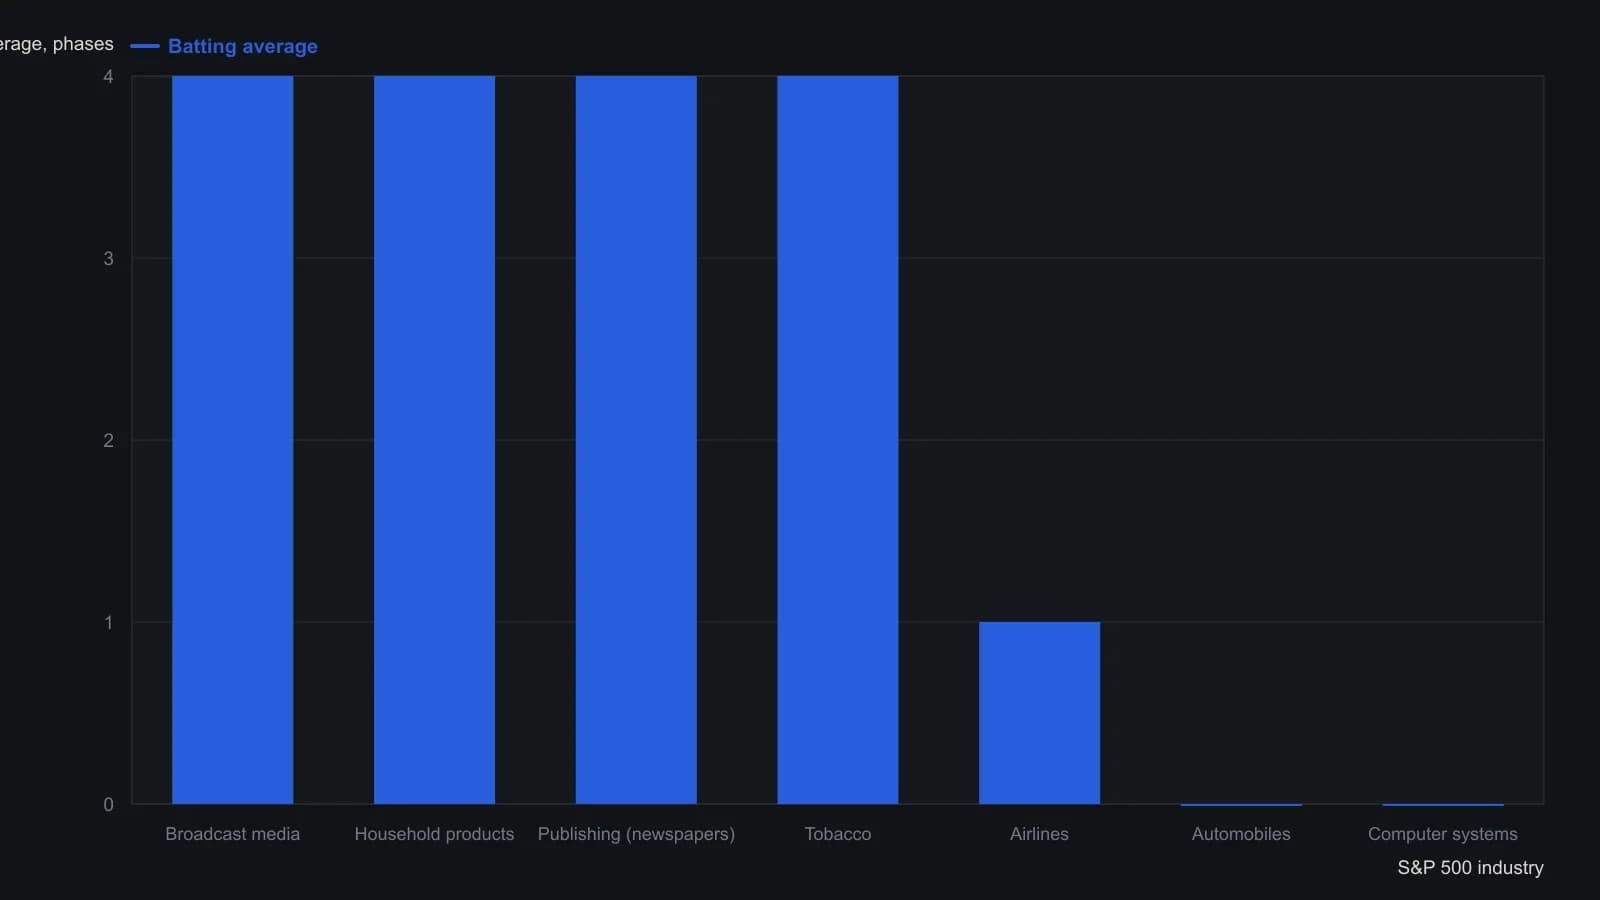
A phase adds a point only when the industry outperformed in more than half of the sample windows for that phase (more than two of four expansions). Stovall used counts instead of average returns so one outsized cycle could not create a false perennial winner. No industry scored 5 of 5.
All readings on this track · 23 readings
- 1985Industry leadership carryover as a bull-regime test
- 1988Constructing industry-group breadth and rotation measures
- 1992Trendline holds, trailing stops, and industry rotation
- 1994Inflation-deflation regimes inside the stock cycle
- 1996Sector rotation across economic cycle phases
- 2001Rebased relative performance charts for sector rotation
- 2001Place a small-cap growth idea inside a regime map
- 2004Rebuild every industry as a share of one rank scoreboard
- 2004Rate-hike regimes and sector rotation as a case study
- 2005A two-name style-index sleeve makes rank rotation one procedure
- 2006Consumer staples after a smokestack cycle
- 2007An intra-sector regime split between builders and equity REITs
- 2008Country and sector weights in an Africa regional-sleeve
- 2011Trend permission, priced entries, and sector rotation
- 2012Construct a regime-aware context from sector rotation
- 2012Regime overlays versus rank rotation
- 2014Rank-based sector rotation as a portfolio test
- 2017Real estate as a ranked industry sleeve
- 2017Theme sleeves: liquidity and commission filters before industry rotation
- 2018Retail sleeve construction through channel rotation and daily leverage
- 2020Water sleeve construction: satellite size, industry mix, and liquidity
- 2020A ranked research terminal as a three-layer watchlist procedure
- 2020Regression channels for sector rotation context