2017issue C0341-47
Real estate as a ranked industry sleeve
A late-2016 snapshot treated listed real estate as a set of property niches rather than one ticker. TradersWeek editorial reading: map those niches, rank the vehicles on shared lookback windows, and let leadership changes decide what stays in the sleeve.
- After the sector split, real estate sat in its own 29-holding sector fund, so the allocation was already a dedicated sleeve rather than a line inside financials.
- More than 30 US-listed real-estate ETFs spanned US property, global property, developed markets, and US mortgages, and specialized-property mixes were not interchangeable.
- The four largest funds held nearly $42 billion and put more than 95% of assets into commercial, specialized, and residential property.
- A one-year ranking through 21 December 2016 did not match the five-largest ranking, so lookback-window leadership and fund size were different screens.
A sleeve, not a single ticker
TradersWeek editorial reading: treat a real-estate allocation as a ranked industry sleeve, not a single ticker. Map the property niches, order the listed vehicles on shared lookback windows, and let leadership changes across those windows decide what stays in the sleeve.
The archive material is a late-2016 comparison of listed real-estate funds. It records how those funds were classified, mixed, and ranked. It does not prescribe a live allocation.
How the funds were lined up
A late-2016 comparison placed five large listed real-estate funds in one table covering inception date, assets, cost, yield, holdings count, a three-year return field, volume, and equity beta.
After a sector-classification change, real estate was removed from a financials-sector fund and housed in a dedicated real-estate sector fund with 29 holdings, bringing that sector-fund set to 11.
The same snapshot described more than 30 US-listed real-estate ETFs spanning US property, global property, developed markets, and US mortgages.
Niches inside the sector
The four largest real-estate ETFs together held nearly $42 billion and allocated more than 95% of assets to commercial, specialized, and residential property.
Specialized-property holdings could include land, prisons, data centers, movie theatres, and casinos, so industry mix inside the sector was not uniform across vehicles.
TradersWeek editorial reading: industry-rotation moves sleeve weight among property niches such as commercial, residential, specialized-property, mortgage, or regional exposure instead of treating real estate as one interchangeable holding.
Rank order and lookback windows
A one-year ranking of tracked real-estate ETFs through 21 December 2016 differed from the ranking of the five largest funds, showing that REIT-market segments led at different times.
Relative-strength comparisons over one, three, and six months plus one year were described as a screen for which real-estate segments had been leading.
Four funds that shared a 29 September 2004 start were ranked on a common price path through 29 December 2016. A 2015 launch was omitted because of its short history.
Twelve-year REIT ETF cumulative returns
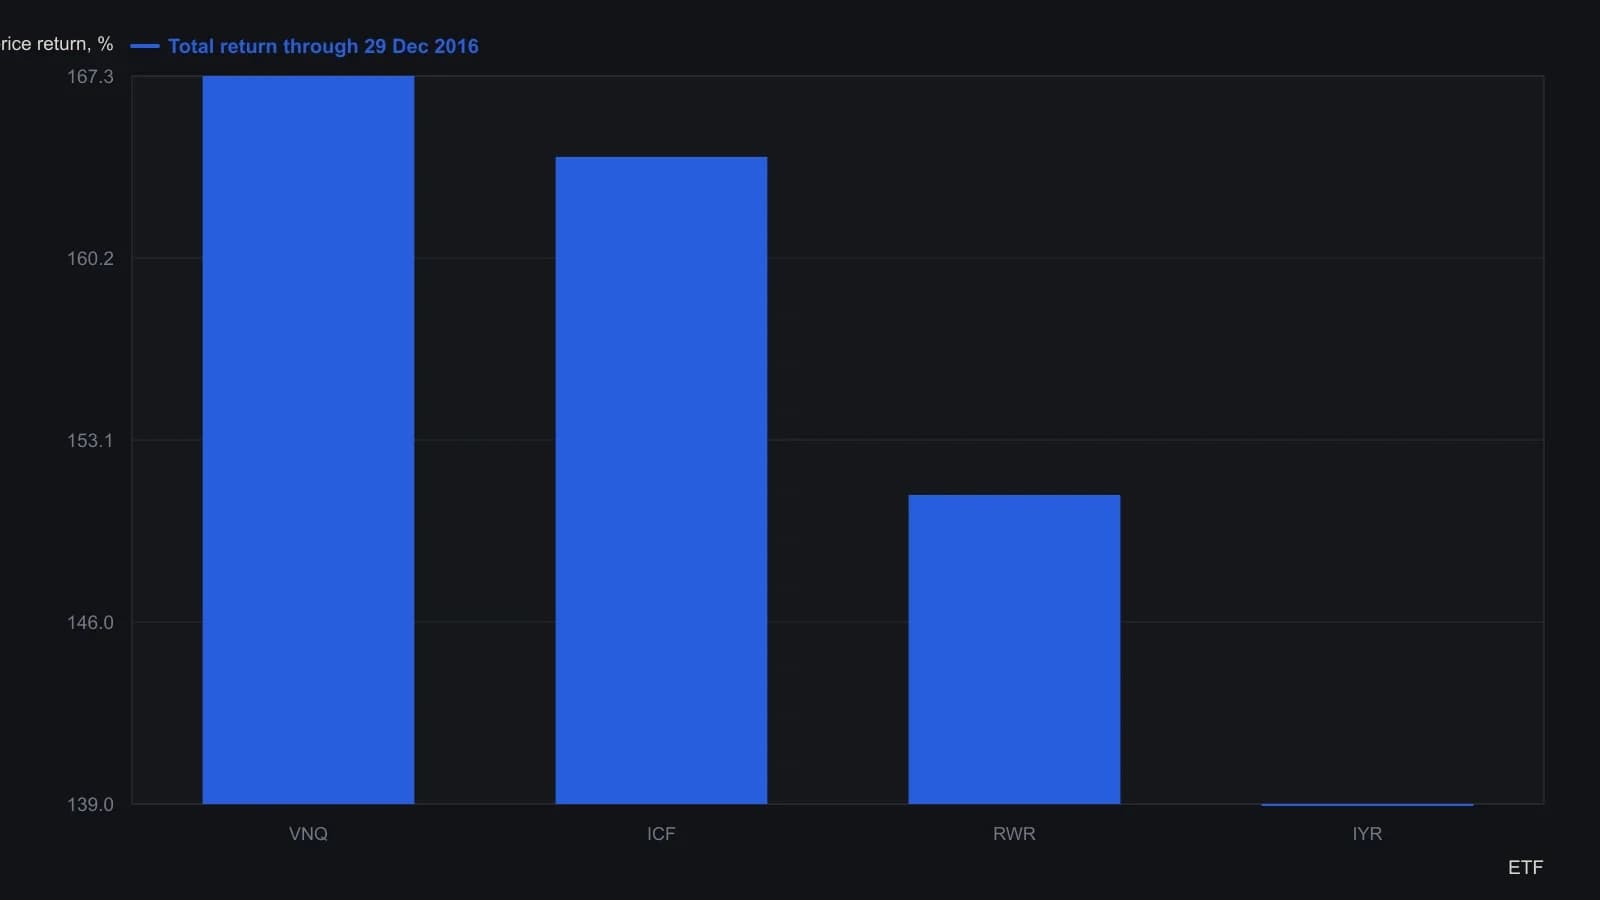
XLRE is excluded because of its 8 October 2015 launch. The window begins on the earliest common date, 29 September 2004.
What the ranks are for
TradersWeek editorial reading: rank-rotation orders listed real-estate vehicles on one shared rule set of breadth, cost, volume, and lookback leadership, and uses that order as the hold, replace, or abstain signal.
TradersWeek editorial reading: seasonal-analysis compares the same vehicles across one-month, three-month, six-month, and one-year lookback-windows to see which niche is leading in the current regime.
TradersWeek editorial reading: the sleeve is a bounded portfolio bucket for listed real-estate exposure. It can hold more than one vehicle when niches and ranks disagree. Changing a lookback-window can change which name leads.
All readings on this track · 23 readings
- 1985Industry leadership carryover as a bull-regime test
- 1988Constructing industry-group breadth and rotation measures
- 1992Trendline holds, trailing stops, and industry rotation
- 1994Inflation-deflation regimes inside the stock cycle
- 1996Sector rotation across economic cycle phases
- 2001Rebased relative performance charts for sector rotation
- 2001Place a small-cap growth idea inside a regime map
- 2004Rebuild every industry as a share of one rank scoreboard
- 2004Rate-hike regimes and sector rotation as a case study
- 2005A two-name style-index sleeve makes rank rotation one procedure
- 2006Consumer staples after a smokestack cycle
- 2007An intra-sector regime split between builders and equity REITs
- 2008Country and sector weights in an Africa regional-sleeve
- 2011Trend permission, priced entries, and sector rotation
- 2012Construct a regime-aware context from sector rotation
- 2012Regime overlays versus rank rotation
- 2014Rank-based sector rotation as a portfolio test
- 2017Real estate as a ranked industry sleeve
- 2017Theme sleeves: liquidity and commission filters before industry rotation
- 2018Retail sleeve construction through channel rotation and daily leverage
- 2020Water sleeve construction: satellite size, industry mix, and liquidity
- 2020A ranked research terminal as a three-layer watchlist procedure
- 2020Regression channels for sector rotation context