1992issue C031-16
Trendline holds, trailing stops, and industry rotation
After a breakout begins an uptrend, this archive workflow uses the trendline as the holding rule, moves the stop-loss higher with that line, and treats industry rotation as regime context rather than a mandatory group trade.
- After a stock breaks out and begins an uptrend, the trendline is the holding rule: profits are allowed to run until a close through the line fails the hypothesis.
- The stop-loss is first set from the chart's invalidation point and is moved higher as the trendline moves higher, so the exit tracks the same price structure that justified the hold.
- Industry timing watches names that have underperformed for several months on a seven-week basis for a sharp one-week jump into the top of the ranking, then treats that reversal as an intermediate-term group hypothesis.
- When rotation is not clean, or the market is stock-oriented, the method drops to individual charts inside the industry and uses the rotation screen only as regime context.
A hold that lives on the trendline
After a stock breaks out and begins an uptrend, a trendline is used as the holding rule. Profits are allowed to run until that line is broken.
A trendline is a rising or falling line drawn from successive swing points. It remains valid only while price respects it. A close through the line is treated as the hypothesis failing.
A stop that ratchets with the line
A stop-loss is placed on the position and is moved higher as the trendline itself moves higher. The exit tracks the same price structure that justified the hold.
A stop-loss in this workflow is a pre-placed exit. It is first set from the chart's invalidation point and then ratcheted with the trendline so a winner is not given back after the structure breaks.
Industry rotation as regime context
Industry timing starts from price momentum. Names that have underperformed for several months on a seven-week basis are watched for a sharp one-week jump into the top of the ranking as a change-of-leadership signal.
That rotation signal is treated as an intermediate-term hypothesis that the group can outperform after the momentum rank reverses.
Industry rotation is a relative-strength screen that flags an industry whose multi-month underperformance suddenly reverses. It is used to place a single name inside a broader leadership or stock-picker regime.
When the market is stock-oriented
When group-level rotation fails to produce clean signals, the method drops to individual stock charts, because winners and losers can appear inside the same industry.
A market can be stock-oriented rather than group-oriented. That is why a rotation overlay is used as regime context instead of a mandatory group trade.
Slow-growth names in the same industry
In a slow-growth setting, charts of strong and weak names inside the same industry are compared to isolate the dividing line between survivors and laggards before a trendline trade is sized.
Potential U.S. equity demand by holder sector
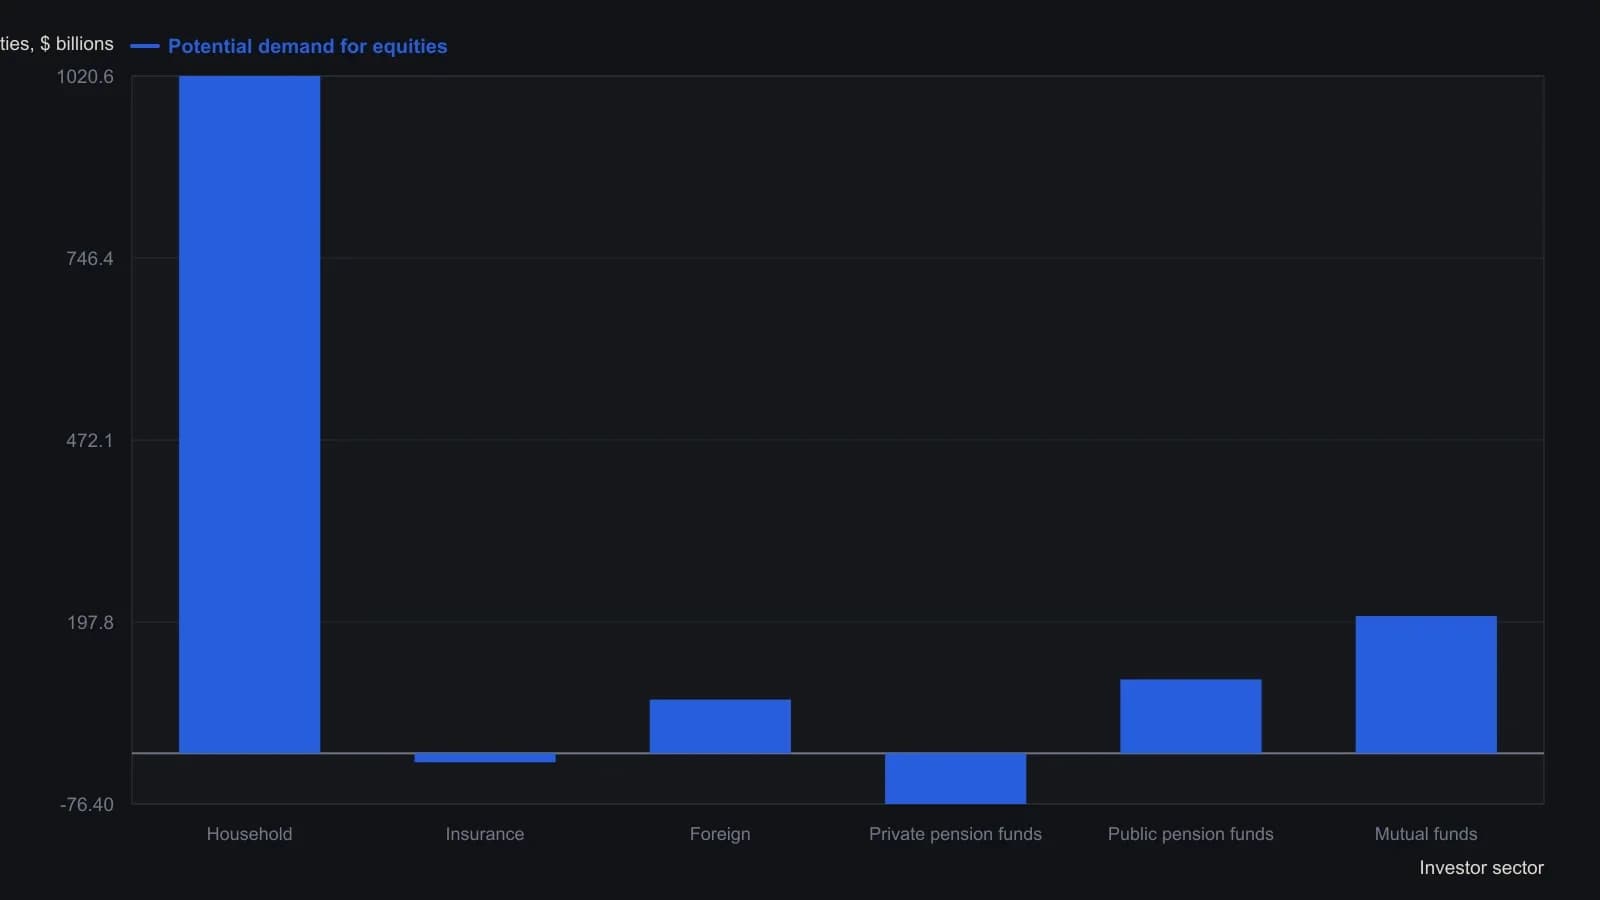
The 53.8% pension benchmark is the private-fund average for 1970–1991 after equity limits were lifted, and Warburg applies that same yardstick to public funds, whose own historic high was only 40.8%. Private-fund equity was restricted until 1949 and public-fund equity through 1970. After stripping possible Federal Reserve double-counting of mutual funds and pension assets, Warburg still put net demand near $1.1 trillion.
All readings on this track · 23 readings
- 1985Industry leadership carryover as a bull-regime test
- 1988Constructing industry-group breadth and rotation measures
- 1992Trendline holds, trailing stops, and industry rotation
- 1994Inflation-deflation regimes inside the stock cycle
- 1996Sector rotation across economic cycle phases
- 2001Rebased relative performance charts for sector rotation
- 2001Place a small-cap growth idea inside a regime map
- 2004Rebuild every industry as a share of one rank scoreboard
- 2004Rate-hike regimes and sector rotation as a case study
- 2005A two-name style-index sleeve makes rank rotation one procedure
- 2006Consumer staples after a smokestack cycle
- 2007An intra-sector regime split between builders and equity REITs
- 2008Country and sector weights in an Africa regional-sleeve
- 2011Trend permission, priced entries, and sector rotation
- 2012Construct a regime-aware context from sector rotation
- 2012Regime overlays versus rank rotation
- 2014Rank-based sector rotation as a portfolio test
- 2017Real estate as a ranked industry sleeve
- 2017Theme sleeves: liquidity and commission filters before industry rotation
- 2018Retail sleeve construction through channel rotation and daily leverage
- 2020Water sleeve construction: satellite size, industry mix, and liquidity
- 2020A ranked research terminal as a three-layer watchlist procedure
- 2020Regression channels for sector rotation context