2020issue C1132-36
Walk-forward and adaptive averages as two tests of the same trend
Two trend-following implementations were compared under a shared risk constraint of about 10 percent: a walk-forward test path and a Kaufman adaptive moving average path. The recorded net-asset-value paths were close, and a walk-forward test remains out-of-sample only if it is run once.
- Evaluation here means comparing two implementations of the same trading idea under a shared risk constraint so the result speaks to test design, not to a preferred indicator.
- A walk-forward test remains an out-of-sample evaluation only if it is run once. Inspecting results, changing a rule, and retesting converts the unused window into another in-sample search.
- The stated preference for the adaptive moving average was that it does not require periodic retesting and removes the chance of retesting with different in-sample and out-of-sample periods.
- The closing claim is that when prices trend, trend methods work, and when they do not, none of the methods work. Timing of returns can differ, but long-run results are expected to be similar.
Two implementations under one constraint
Trend following is a family of entry, exit, and hold rules that stay with a measured direction of price until that direction fails, rather than forecasting a reversal.
This archive evaluation compared two implementations of that idea under a shared risk constraint of about 10 percent: a walk-forward test path and a Kaufman adaptive moving average (KAMA) path.
Walk-forward analysis is a testing procedure that repeatedly optimizes a rule on an in-sample window, then records only the next unused out-of-sample window, and concatenates those unused windows into one evaluation path.
An adaptive moving average is a trend filter that changes its effective lookback as market noise and speed change, so the same rule can slow in choppy periods and speed up when prices persist.
Walk-forward portfolio NAV after 10% volatility targeting
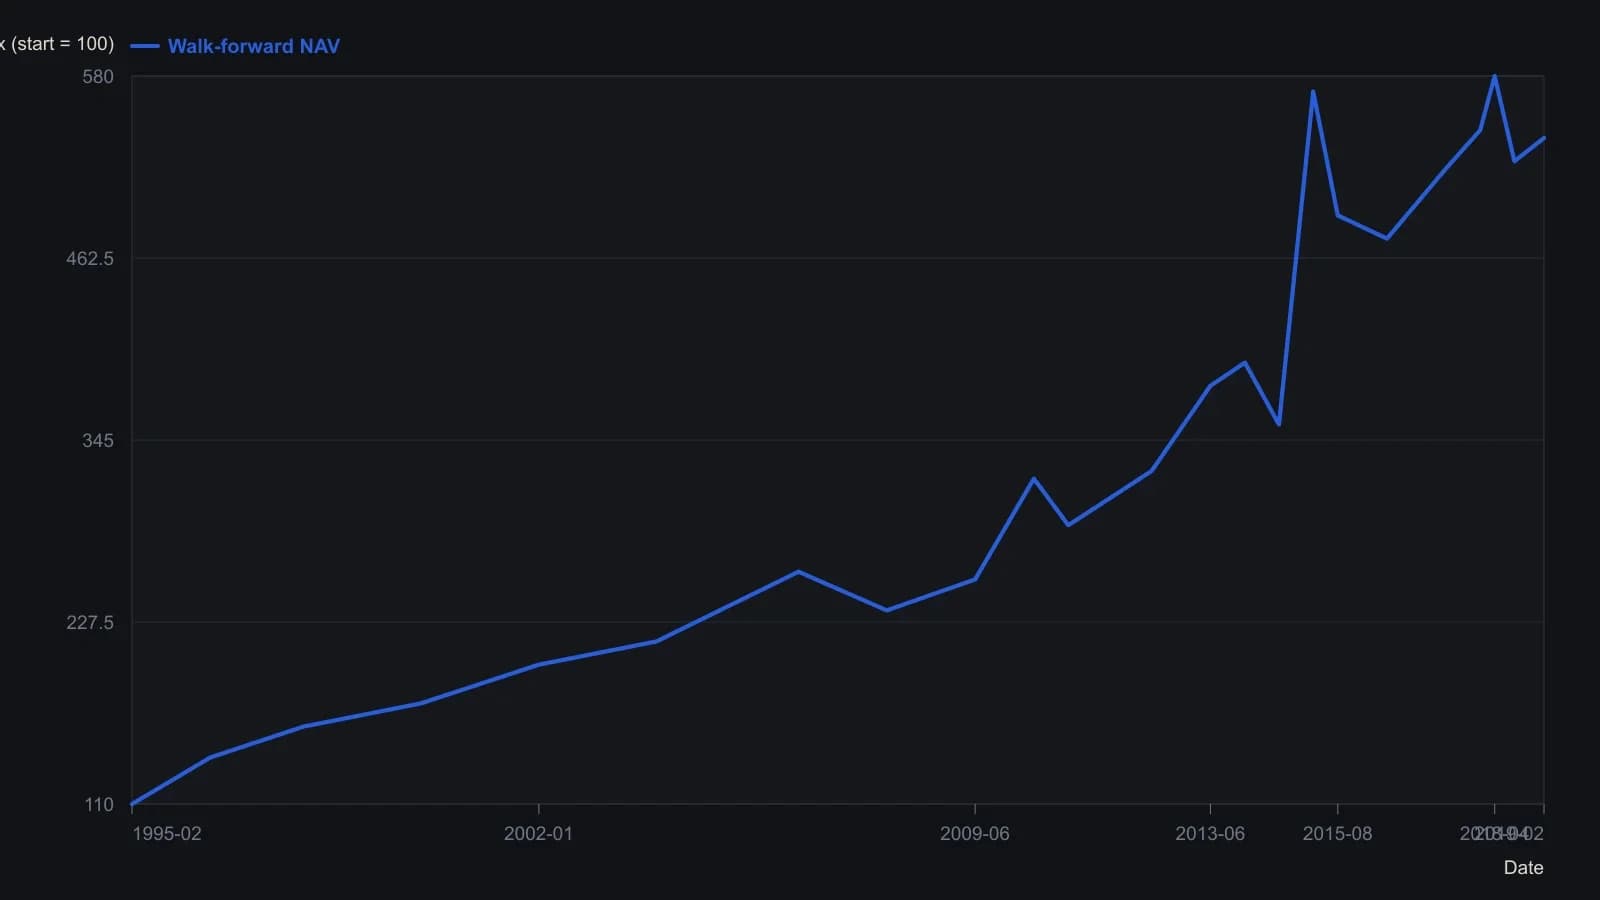
Five-year in-sample window, six-month out-of-sample step, long-only in bonds and the S&P, long and short in the euro and crude. Plotted NAV points are approximate readings from the raster; the 7.2 percent annualized return is the figure stated in the article.
What the recorded paths showed
From March 1993, the walk-forward path returned 7.2 percent annually and the KAMA path returned 7.1 percent annually.
KAMA produced a reward-to-risk ratio of 0.74, slightly higher than the 0.72 recorded for the walk-forward test.
The two net-asset-value paths were described as close overall, with a difference in pattern: KAMA made new highs in the recent market, while later periods were expected to keep the paths tracking closely.
How the speed was chosen
The parameter choice targeted a trend whose speed could vary but averaged about 60 days. That choice was selected from the type of system desired rather than from repeated out-of-sample inspection.
The stated preference for KAMA was that it does not require periodic retesting and removes the chance of retesting with different in-sample and out-of-sample periods.
When trend methods work
The evaluation's closing claim is that when prices trend, trend methods work, and when they do not, none of the methods work. Timing of returns can differ, but long-run results are expected to be similar.
All readings on this track · 24 readings
- 1991Building variable-length moving averages from partitioned price changes
- 1991Variable-length moving average from change dispersion
- 1992Constructing volatility-adaptive exponential smoothing
- 1995Constructing an adaptive moving average with an efficiency ratio and filter
- 1995Two-gate breakout confirmation with adaptive averages
- 1995Building momentum-scaled adaptive moving averages
- 1995Adaptive length as a construction choice inside exponential smoothing
- 1998Testing price-channel breakouts with a lag-aware adaptive average
- 1998Constructing filters by nesting offsets and variable weights
- 1998Constructing an efficiency ratio adaptive average and entry filter
- 2001Encoding candle structure as a numeric filter
- 2001Adaptive averages driven by cycle-phase speed
- 2005Constructing an adaptive moving average from a fractal-dimension weight
- 2005Range-dimension adaptive exponential filter
- 2010Constructing simple, exponential, and adaptive averages
- 2010How a price-hugging smoother is assembled from ordinary averages
- 2013Evaluating an adaptive moving average against a same-window moving average
- 2016Three-layer confirmation: adaptive average, stochastic relative strength index, and stop-and-reverse
- 2017One-alpha reverse-path exponential smoothing
- 2018Pair two adaptive averages to filter swing turns
- 2018Two Adaptive moving averages as a confirmation pair
- 2018Constructing an adaptive filter for adoption-cycle reversals
- 2018Constructing a deviation-scaled adaptive moving average
- 2020Walk-forward and adaptive averages as two tests of the same trend