1991issue C061
Building variable-length moving averages from partitioned price changes
Construction of a variable-length moving average starts with explicit lookback bounds, estimates price-change dispersion from a long enough initial sample, and then steps the lookback when a new price change falls in a trigger partition band.
- Construction begins by setting explicit minimum and maximum lookback lengths that cap how far the averaging window may adjust.
- The mean and standard deviation of price changes are estimated from an initial sample that should be at least as long as the maximum allowed moving-average length, then used to cut partition bands in standard deviations from the mean.
- The lookback shortens by one day when a price change lands in the extreme band, lengthens by one day in the near-mean band, and is left unchanged in the intermediate band or when a bound has already been reached.
- After each new observation, the moving-average value, the mean price change, the standard deviation, and the partition boundaries are recalculated before the next period.
A moving average is a forecast formed from ordered price observations over a defined lookback interval. An adaptive moving average is a moving average whose lookback shortens or lengthens as new price changes fall into predefined distribution bands. Construction of the variable-length moving average begins by setting explicit minimum and maximum allowed lookback lengths.
Lookback bounds and price-change dispersion
Lookback bounds are the minimum and maximum lengths that cap how far the averaging window may adjust.
Price-change dispersion is the sample mean and standard deviation of successive price changes used to place the adjustment bands. The mean and standard deviation of price changes are estimated from an initial sample that should be at least as long as the maximum allowed moving-average length.
Partition bands
A partition band is a region of the price-change distribution, measured in standard deviations from the mean, that either triggers a length change or leaves length unchanged. Length-adjustment sensitivity is set by partitioning the price-change distribution into bands defined in standard deviations from the mean.
If price changes are treated as normally distributed, about 68 percent of observations are expected within one standard deviation of the mean, 95 percent within two, and 99.7 percent within three.
One construction example places a near-mean band at plus or minus 0.25 standard deviations and an extreme band beyond plus or minus 1.75 standard deviations. In that example the four partition boundaries evaluate to -0.19, 0.06, 0.14, and 0.39.
Length step and unchanged cases
A length step is the number of sampling intervals by which the lookback moves when an observation lands in a trigger band. The lookback shortens by one day when a price change lands in the extreme band and lengthens by one day when it lands in the near-mean band. The lookback is left unchanged when the observation is in the intermediate band or when the current length is already at its minimum or maximum.
Recalculation before the next period
After each new observation, the moving-average value, the mean price change, the standard deviation, and the partition boundaries are recalculated before the next period.
Example A–D partition boundaries for the variable-length average
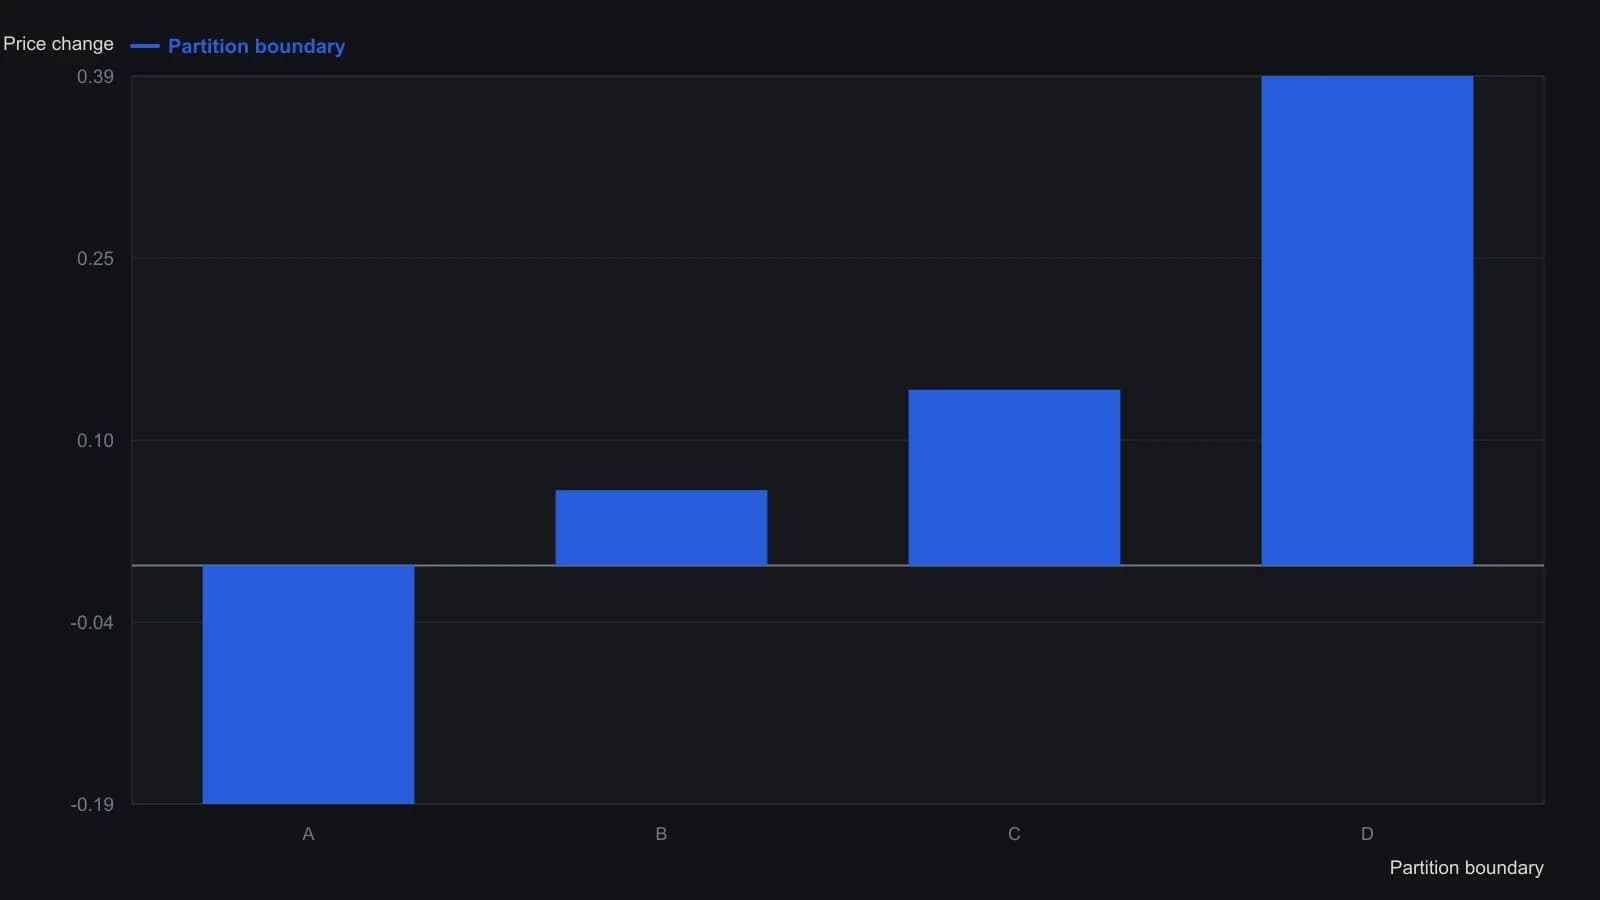
The sidebar's example fixes Area 1 at ±0.25 standard deviations, Area 3 beyond ±1.75 standard deviations, and lookback between five and ten days.
All readings on this track · 24 readings
- 1991Building variable-length moving averages from partitioned price changes
- 1991Variable-length moving average from change dispersion
- 1992Constructing volatility-adaptive exponential smoothing
- 1995Constructing an adaptive moving average with an efficiency ratio and filter
- 1995Two-gate breakout confirmation with adaptive averages
- 1995Building momentum-scaled adaptive moving averages
- 1995Adaptive length as a construction choice inside exponential smoothing
- 1998Testing price-channel breakouts with a lag-aware adaptive average
- 1998Constructing filters by nesting offsets and variable weights
- 1998Constructing an efficiency ratio adaptive average and entry filter
- 2001Encoding candle structure as a numeric filter
- 2001Adaptive averages driven by cycle-phase speed
- 2005Constructing an adaptive moving average from a fractal-dimension weight
- 2005Range-dimension adaptive exponential filter
- 2010Constructing simple, exponential, and adaptive averages
- 2010How a price-hugging smoother is assembled from ordinary averages
- 2013Evaluating an adaptive moving average against a same-window moving average
- 2016Three-layer confirmation: adaptive average, stochastic relative strength index, and stop-and-reverse
- 2017One-alpha reverse-path exponential smoothing
- 2018Pair two adaptive averages to filter swing turns
- 2018Two Adaptive moving averages as a confirmation pair
- 2018Constructing an adaptive filter for adoption-cycle reversals
- 2018Constructing a deviation-scaled adaptive moving average
- 2020Walk-forward and adaptive averages as two tests of the same trend