2016issue C0210-12
Three-layer confirmation: adaptive average, stochastic relative strength index, and stop-and-reverse
A confirming combination of three indicators is presented for foreign-exchange and equity charts. An adaptive moving average sets a buy or sell zone, a stochastic reading of the relative strength index marks overbought and oversold bands, and a stepped stop-and-reverse overlay refines entry and exit after those layers are in place.
- The first layer is an adaptive moving average used as a trend filter that splits the chosen time frame into a buy zone above the line and a sell zone below it.
- The second layer applies the stochastic oscillator to relative-strength-index values, producing a reading from zero to one that two thresholds then split into overbought, mid, and oversold bands.
- The third layer is a stop-and-reverse overlay that plots in steps from the period average of highs and the period average of lows, used after trend and oscillator context are set to refine entries, exits, and short-term pullbacks.
- Convergence is the decision rule: several independent indicator readings must agree on the same directional conclusion before a trade plan is treated as complete.
A confirming combination for two markets
A confirming combination of three indicators is presented as applicable to both foreign-exchange and equity charts. The layers are meant to be read in order: first a zone from an adaptive moving average, then an exhaustion reading from a stochastic transform of the relative strength index, then a stepped stop-and-reverse overlay that refines entry and exit.
Layer one: adaptive moving average
The first layer is an adaptive moving average used to classify the chosen time frame into a buy zone above the average and a sell zone below it. That adaptive average is defined as a smoothed moving average lying between a double exponential moving average and an exponential moving average, with signals generated in the same manner as other moving averages.
Layer two: a stochastic reading of the relative strength index
The second layer applies the stochastic-oscillator formula to relative-strength-index values, producing a reading that ranges from zero to one. The relative strength index is the ordered-price series that this range-normalization is applied to, so the combined oscillator is bounded.
Two horizontal thresholds divide that oscillator into three bands. A break of the upper band is treated as overbought and a break of the lower band as oversold. Each break is associated with an expected turn or correction.
Layer three: stop-and-reverse overlay
The third layer is a stop-and-reverse indicator that plots in steps from the period average of highs and the period average of lows. It is used to refine entry and exit after trend and oscillator context are set. On that overlay, price above the upper step during an uptrend is treated as a continuation condition, while candles beneath the lower step are treated as a short-term pullback inside a buy zone.
Convergence as the decision rule
The intended decision rule is convergence. Several independent indicators must point to the same directional conclusion before a trade plan is treated as complete.
USD/CHF hourly price versus Tillson’s T3 average
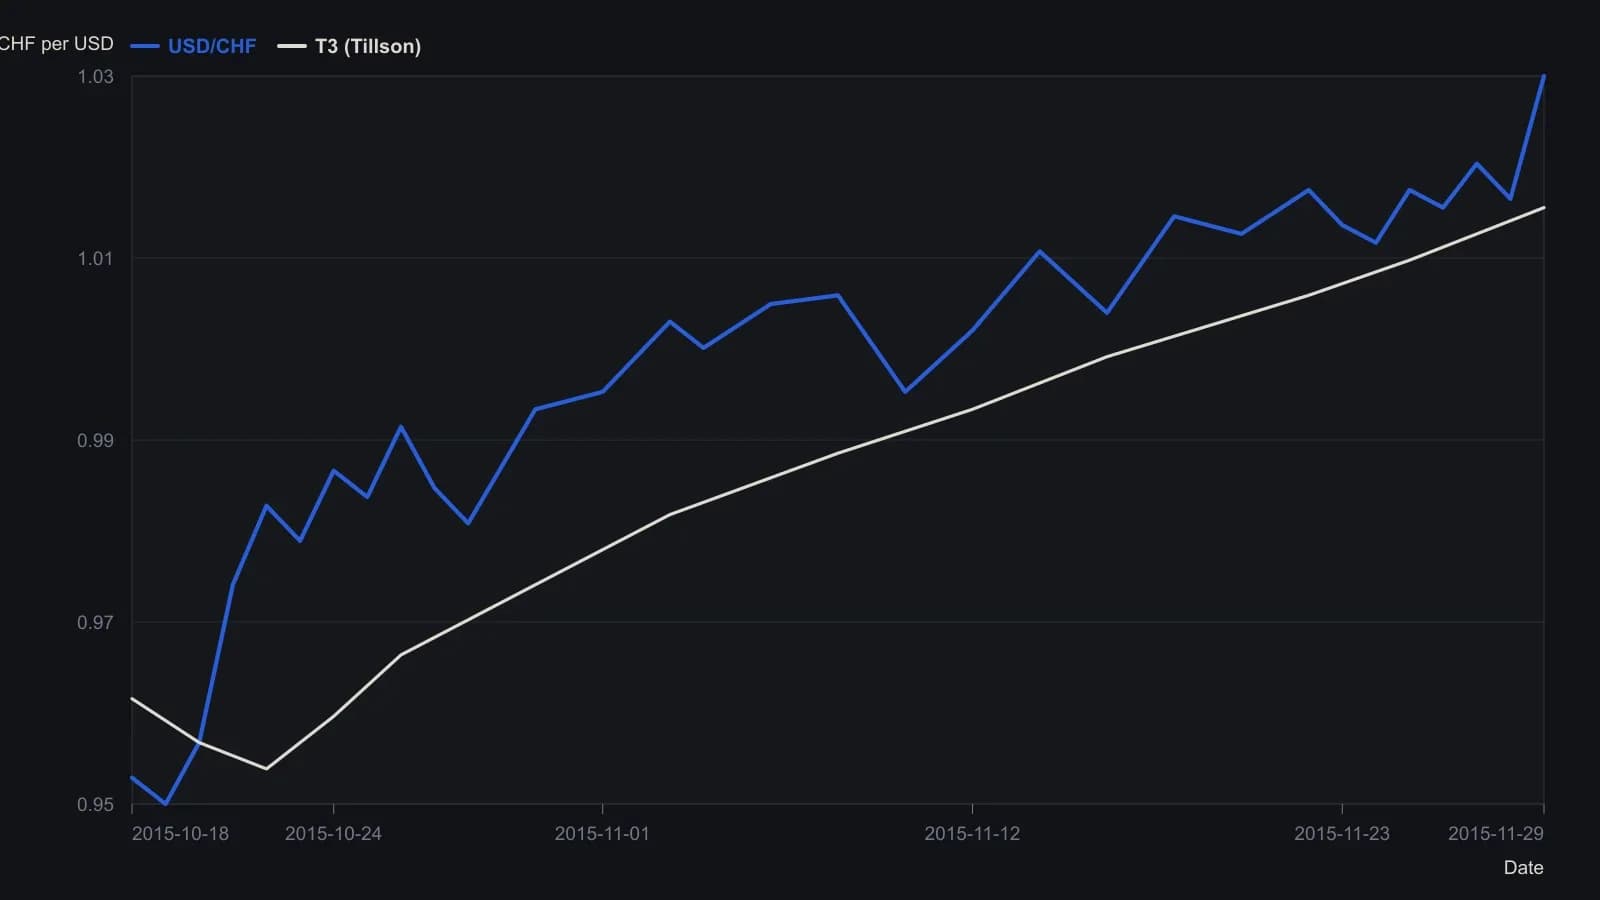
Visual readings are approximate to about 0.001 in the rate. The platform quote box on the figure prints a last price of 1.03264.
All readings on this track · 24 readings
- 1991Building variable-length moving averages from partitioned price changes
- 1991Variable-length moving average from change dispersion
- 1992Constructing volatility-adaptive exponential smoothing
- 1995Constructing an adaptive moving average with an efficiency ratio and filter
- 1995Two-gate breakout confirmation with adaptive averages
- 1995Building momentum-scaled adaptive moving averages
- 1995Adaptive length as a construction choice inside exponential smoothing
- 1998Testing price-channel breakouts with a lag-aware adaptive average
- 1998Constructing filters by nesting offsets and variable weights
- 1998Constructing an efficiency ratio adaptive average and entry filter
- 2001Encoding candle structure as a numeric filter
- 2001Adaptive averages driven by cycle-phase speed
- 2005Constructing an adaptive moving average from a fractal-dimension weight
- 2005Range-dimension adaptive exponential filter
- 2010Constructing simple, exponential, and adaptive averages
- 2010How a price-hugging smoother is assembled from ordinary averages
- 2013Evaluating an adaptive moving average against a same-window moving average
- 2016Three-layer confirmation: adaptive average, stochastic relative strength index, and stop-and-reverse
- 2017One-alpha reverse-path exponential smoothing
- 2018Pair two adaptive averages to filter swing turns
- 2018Two Adaptive moving averages as a confirmation pair
- 2018Constructing an adaptive filter for adoption-cycle reversals
- 2018Constructing a deviation-scaled adaptive moving average
- 2020Walk-forward and adaptive averages as two tests of the same trend