1986issue C041-5
Force, a tested spring, and the conservative count
TradersWeek teaches one three-step drill on a single June 1982 bond congestion: judge which side still has force, require a spring that holds its test, and keep only the conservative point-and-figure count as the working hypothesis until effort and result flip.
- The same cues of price, volume, activity, support, and pressure serve the next half-hour swing and a two-to-three-week trend; only how often opportunities appear changes.
- A spring is a break through support that then reverses, and it is treated as tested only when the next pullback holds above that reversal low and volume contracts.
- After force and a tested spring, the nearer point-and-figure objective stays the working hypothesis until effort and result flip.
- Tick volume counts how often price changes inside a chosen bar, not how many contracts traded.
A three-step reading of one congestion
TradersWeek frames this archive case as a single drill on one bond range. First judge which side still has force. Next require a spring that holds its test. Then treat only the conservative point-and-figure count as the working hypothesis until effort and result flip.
The same cues of price, volume, activity, support, and pressure are used for the next half-hour swing and for a two-to-three-week trend. Only how often opportunities appear changes.
First, which side still has force
The Wyckoff method here means judging which side has the greater force from price, volume, activity, support, and pressure so the next swing can be framed as a testable hypothesis.
Tick volume records how often price changes inside a bar, not contract turnover, and can be plotted on 5-minute, 45-minute, or 60-minute bars. Effort versus result then compares volume expended with distance gained to judge whether demand or supply is getting a result or meeting resistance.
In the case, heavy volume that failed to extend the advance was read as demand meeting resistance. A later volume surge on the decline was read as supply taking control.
Then a spring that holds its test
A spring is a break through support that then reverses. It is treated as tested when the next pullback holds above that reversal low and volume contracts. An upthrust is the mirror failure above resistance.
A selling climax is a decline in which volume is heavier than on prior bars of the same downswing and the close shows buying already present. After a climax low and a failed probe to new lows, a narrow, quiet return toward the small range was labeled a springboard, with invalidation placed under the reversal. That springboard is treated as the last quiet spot before a fast attempt to leave the range.
The June 1982 bond congestion
The June 1982 bond case is read on 45-minute bars from 23 March through 7 April inside a 64-08 to 61-08 range, after a 56-08 low, a 66-23 high, and a 57-10 retest.
On 7 April, three consecutive 45-minute closes inside a 2/32 band were taken as spent selling after an 8-day range, marking a critical point where a close stop could sit behind the turn. A critical point is a moment in a swing when force on both sides looks nearly spent and a close invalidation can sit just beyond the turn.
The range was reconstructed as accumulation. The case specified a long with a protective sell stop under the last breakdown and stated that historical risk as 6/32nds. That specification belongs to the historical workflow, not to a present recommendation.
June 1982 T-bond 45-minute prices
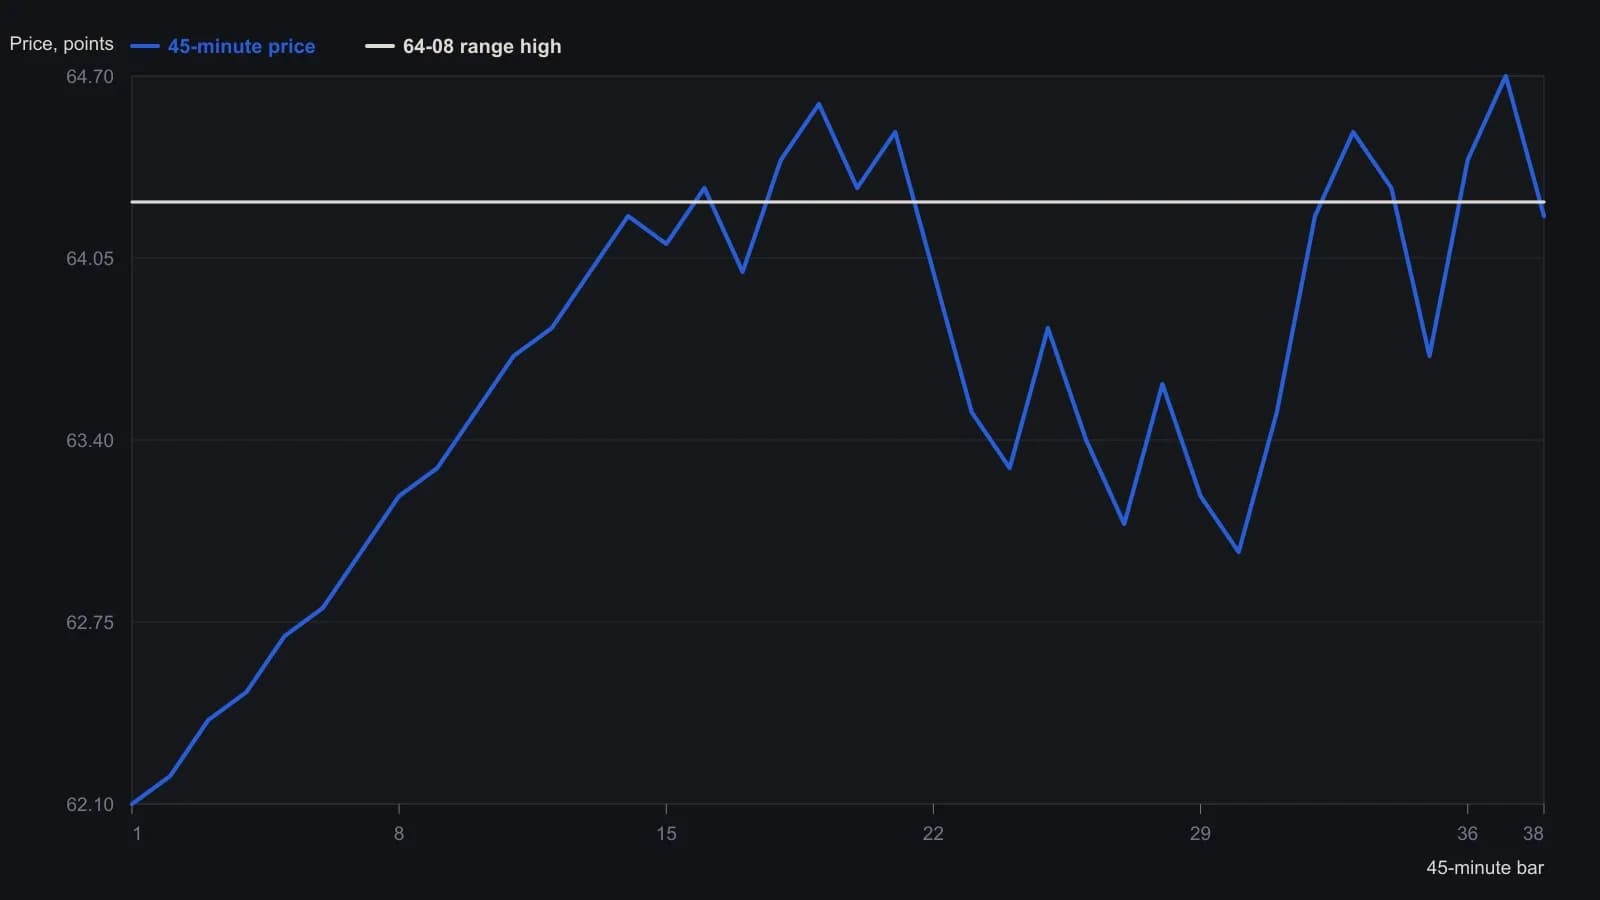
Read off the scanned 45-minute bars to the nearest 0.1 point; not every bar is included. The 64-08 line is the range high stated in the article (64 + 8/32).
Keep only the nearer count working
Point and figure here means a box-and-reversal count across congestion used to project how far price may travel once a range resolves. A 4-by-12 point-and-figure chart with 4/32 boxes and 12/32 reversals counted the 61-08 congestion to a conservative 63-28 objective and a larger 66-28 objective, with attention kept on the nearer count.
The conservative count is the nearer point-and-figure objective taken from the tightest congestion. TradersWeek reads that nearer objective as the working hypothesis until effort and result flip. The larger count is recorded, not treated as the live target.
All readings on this track · 6 readings
- 1985Constructing chart congestion from triangles, springs, and pivots
- 1986Force, a tested spring, and the conservative count
- 1992Construct a Wyckoff futures read from delayed volume and range tests
- 1998A Wyckoff spring is unfinished until it is a few-parameter system
- 2002Constructing trend swings from confirmed pivots
- 2011Potential versus confirmed Wyckoff springs