1989issue C121-6
Gann angles on point-and-figure grids
Geometric angles can be drawn on a point-and-figure reversal chart by counting squares. Because both axes represent price, the lines mark possible reversal prices rather than dates, and an intersection can be read as resistance or as continuation if broken.
- A daily point-and-figure chart posts only moves at least as large as the chosen box size, marking advances with X columns and declines with O columns.
- Gann angle lines are counted in squares from a prior low as candidate support, or downward from a prior high as candidate resistance.
- The one-by-one path is treated as the 45-degree line and given the greatest weight. Other angle counts can confirm the same band.
- An intersection-zone is classified as resistance when the preceding column is below it, and a break through that intersection is read as directional continuation.
Price change on a reversal grid
Geometric angles can be drawn on point-and-figure reversal charts, where the posted series emphasizes price change rather than a joint price-and-time record. A daily point-and-figure chart is built from a chosen box size and reversal count. Only moves at least as large as the box are posted, with advancing columns marked by Xs and declining columns by Os.
Box size is the minimum price increment recorded as one square on the grid. Reversal is the number of boxes required to leave the current column and start a new column in the opposite direction.
Posting a soybean-futures series
One soybean-futures construction uses a 2-cent box and 6-cent reversal, equivalently an 8-tick box and 24-tick reversal when the contract ticks in quarter-cent increments. The example series begins at 8.50.
After a posted high of 8.54, a further one-cent rise is omitted as smaller than the box. A drop beyond the 6-cent reversal opens an O column one square below that high at 8.52 and continues to 8.40.
Angle families counted in squares
On a 1:1 scale the usual angle set includes 7-1/2, 15, 45, 63-3/4, 75, and 82-1/2 degrees. The 7-1/2-degree line is counted eight units across and one unit vertically (8x1). The 45-degree line is the one-by-one, counted as one square across and one square vertically.
Because both point-and-figure axes represent price, the grid is equally scaled and Gann lines are drawn by counting squares. Without a time axis those lines mark possible reversal prices rather than dates.
Gann angles are straight lines drawn from a prior high or low by a fixed count of horizontal and vertical squares, used as candidate support or resistance. The one-by-one path is treated as the 45-degree angle and given the greatest weight in the family.
Support, resistance, and intersection zones
Angle lines originating at a prior low are read as candidate support. The same unit counts drawn downward from a prior high are read as candidate resistance. Other angle counts from additional highs or lows can confirm the same support or resistance band.
Support and resistance here means price bands where an angle, a prior extreme, or an intersection of angles is treated as a possible pause, reversal, or continuation if broken. An intersection-zone is a grid location where two angle lines meet, given extra weight as a candidate turning area or, if penetrated, as a continuation signal.
A soybean reversal example uses a 5-cent box and 15-cent reversal, projecting a 1x4 line from a 6.80 low and a 1x2 line from a 10.45 high. An intersection is classified as resistance when the preceding column is below it, and a break through an intersection is read as directional continuation.
November 1988 soybeans on a 5x15 point-and-figure grid
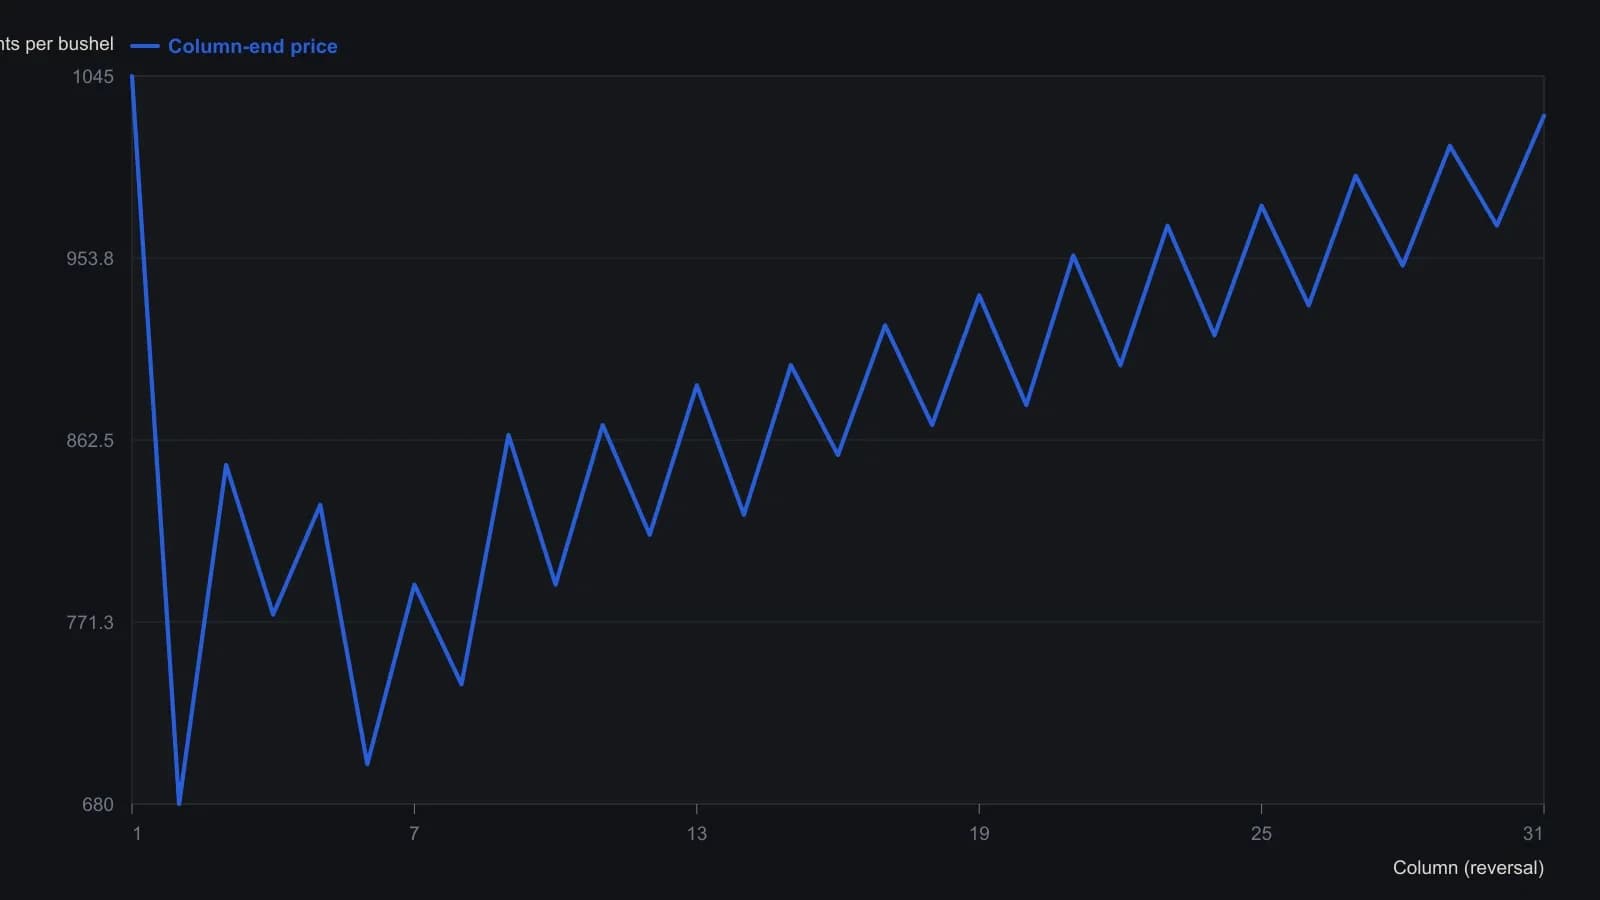
Each point is the last posted box in a column (X high or O low). Box size is 5 cents, so readings are to the nearest 5 cents; angle lines themselves are not plotted.
All readings on this track · 34 readings
- 1984Range grid to sideways break in 1984 gold
- 1985When Gann lines, Gann angles, and a Fibonacci retracement coincide
- 1987Evaluating angular cycle overlays on independent stock swings
- 1988Multi-scale Elliott counts with Gann and Fibonacci confluence
- 1988Gann angles as hand-scaled chart geometry
- 1989A time, price, and pattern filter on one platinum sequence
- 1989Gann angles on point-and-figure grids
- 1990Gann price-time clusters for Elliott retracements
- 1990Channel regimes and Gann angle hinges
- 1990A gold campaign log as a trade procedure
- 1991A fourth Treasury bond resistance test as one time-price hypothesis
- 1991An eclipse calendar as a testable cycle scaffold
- 1992Gann-angle intersections and half-range zones
- 1998Wave and ratio self-similarity as a testable chart hypothesis
- 2000Constructing Gann fan angles from swing extremes
- 2002Combining Fibonacci retracement, Gann angles, and the moving average in FX
- 2002Halfway retracement as a trend confirmation filter
- 2006Volume distribution, Fibonacci extensions, and Gann angles on one downswing
- 2007Constructing Gann fans as currency support and resistance
- 2010ABC completion, wave-two windows, and Gann ratios
- 2010Constructing a Gann, Fibonacci, and decade-scale reversal cluster
- 2010Gann angles as timed tests that still need structure and RSI
- 2010Gann angles heritage is not a signal
- 2010Gann-fan time windows confirmed by Elliott-wave position
- 2010Gann angles as a repeatable chart hypothesis
- 2011Wave and ratio overlays as confirmation, not forecasts
- 2013Gold wave four as a time and price cluster check
- 2014A case study that separates cycle forecasts from Gann and Elliott readings
- 2014Relative charting, Gann angles, and trendline breakouts
- 2016Gann fans and a 2016 long-wave case as checkpoints, not forecasts
- 2017Gann angles, scale dependence, and the gap between legend and method
- 2017Gann angles as overlay, not original practice
- 2018Combine Gann angles, oscillator zones, and a protective stop
- 2020Confirming Gann hi-lo swings with ADX and stochastics